



At its core, a 3 statement financial model is a dynamic spreadsheet that connects your company's income statement, balance sheet, and cash flow statement into a single, cohesive financial forecast. Don't just think of it as a bunch of reports. Think of it as the single source of truth for your business's financial health—showing where you've been, where you are, and where you're actually going.
Why Your Business Needs a 3 Statement Financial Model
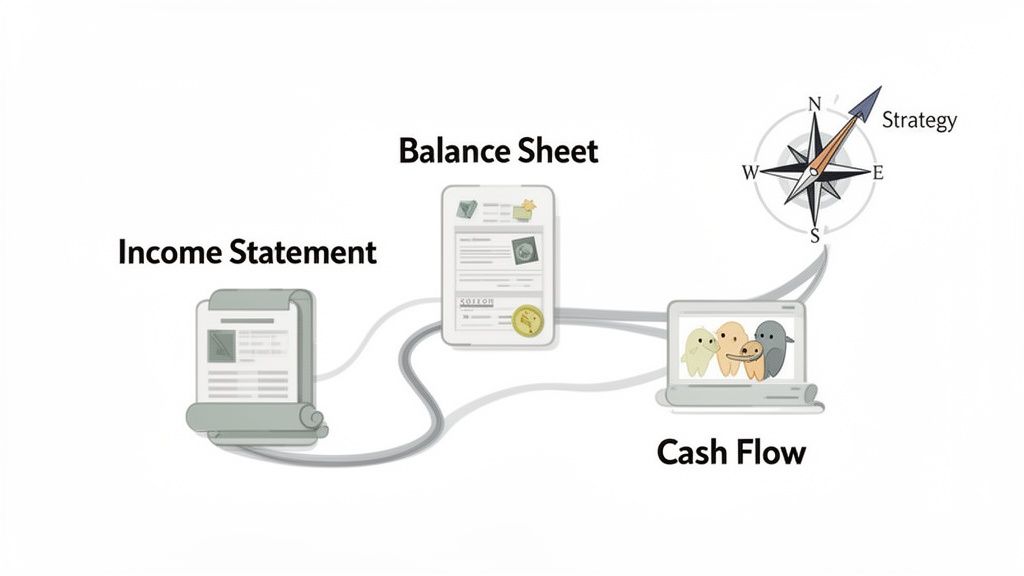

Trying to run a startup or a growing business without a solid 3 statement model is like navigating a ship through a storm without a map or compass. Sure, you have a general sense of direction, but you have no way of seeing the rocks just below the surface. This integrated model is your ultimate navigation system, turning abstract numbers into a clear, actionable story about your business.
It’s a huge misconception that these models are only for fundraising. While they are absolutely critical for proving your business case to investors, their real power lies in the day-to-day strategic decisions you have to make. By weaving together the three core financial statements, you get a holistic view that isolated reports just can't offer.
Uncovering the Complete Financial Picture
Each of the three statements tells part of your company's story. It's only when you put them together that you see the full narrative.
- The Income Statement shows your profitability over a specific period. It answers the simple question, "Did we make money?"
- The Balance Sheet gives you a snapshot of your assets, liabilities, and equity at a single point in time. It answers, "What do we own, and what do we owe?"
- The Cash Flow Statement tracks the actual movement of cash from operations, investing, and financing. This answers the most critical question of all: "Where did our cash actually go?"
The magic happens when these are all linked together. I've seen plenty of companies that look profitable on their income statement but still run out of cash and go under. A 3 statement model flags this kind of risk by showing exactly how profit (or loss) hits your cash balance after you account for things like buying inventory or making debt payments.
A financial model forces you to think through the drivers of your business. It transforms vague goals into concrete numbers, creating a direct line of sight between your operational activities and your financial outcomes.
From Reactive Reporting to Proactive Strategy
Too many businesses treat their financial data like a history book—a tool for looking backward. A dynamic 3 statement model flips that script, turning historical data into a forward-looking strategic asset. It lets you ask and answer the critical "what-if" questions that truly drive growth.
For instance, what happens to your cash runway if you hire two new engineers? How does a 10% increase in customer acquisition costs impact your profitability next year? You can't answer these questions accurately without a model where a change in one area—like payroll expense—automatically flows through to your net income, retained earnings, and, ultimately, your ending cash balance.
This is exactly how experienced fractional finance executives use these models. They aren't just for reporting; they are the centerpiece of strategic conversations that guide hiring decisions, manage cash burn, and build a more resilient business. For a deeper look at this forward-looking approach, check out our guide on financial forecasting for startups.
Ultimately, building this model is about ditching the guesswork and stepping into informed leadership, ensuring every major decision is grounded in a clear understanding of its financial impact.
Laying the Foundation: Assumptions and Historical Data
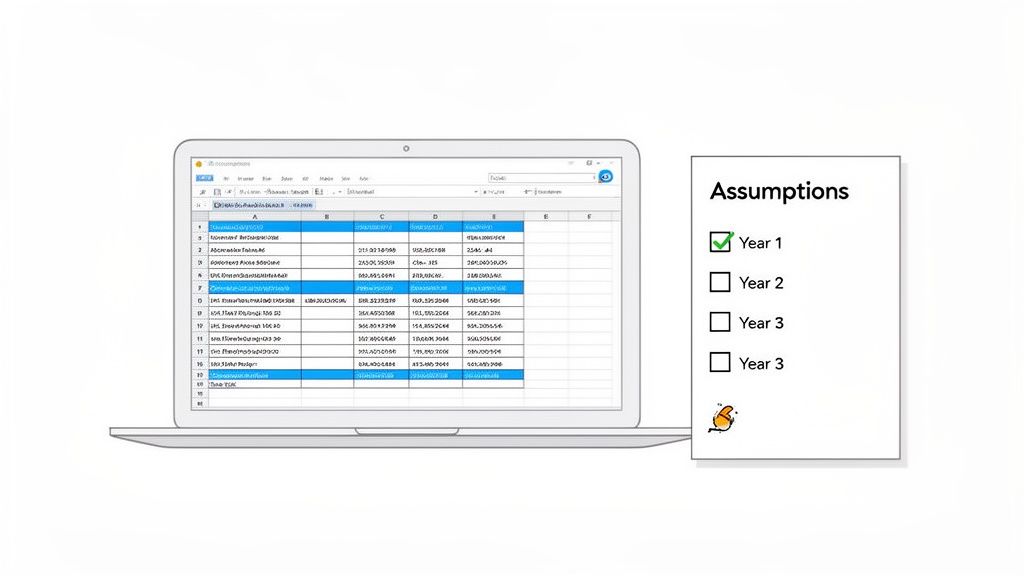
Every powerful forecast is built on a solid foundation. Just as an architect needs detailed blueprints before breaking ground, you need a collection of historical data and a clear set of assumptions to build a reliable 3-statement financial model.
This initial phase isn't just about plugging in numbers. It's the most critical step for making sure your model is a strategic tool, not just a spreadsheet full of wishful thinking.
The most important material you have is your own historical financial data. If you can, pull at least three years of your income statements, balance sheets, and cash flow statements. If your business is younger than that, just gather everything you have.
This depth is crucial. It lets you spot trends, understand seasonality, and calculate the key ratios that will drive your forecast. Without it, your assumptions are just educated guesses. In fact, professional analysis shows that models built with 3-5 years of financial statements can achieve forecasting accuracy rates up to 85% higher than those using less than two years of data. That's because real, meaningful patterns only emerge over time.
Structure Your Spreadsheet for Success
Once you have your historical data, you need to structure your spreadsheet for clarity. A messy model is an error-prone model. It’s that simple. One of the best things you can do is adopt a consistent color-coding system.
A widely used convention is:
- Blue Text: For hard-coded numbers and direct inputs (your assumptions and historical data).
- Black Text: For all formulas and calculations derived from your inputs.
- Green Text: For any formulas that link to other worksheets in the same file.
This simple visual discipline makes your model infinitely easier to audit and update. When you need to change a number, you immediately see which cells are safe to edit (the blue ones) without breaking a complex chain of formulas.
Building a model is a lot like telling a story with numbers. Each tab, from historicals to assumptions to the final statements, is a chapter. Keeping them organized and clean ensures the narrative is clear, consistent, and easy for anyone to follow.
This organization is fundamental. It prevents the all-too-common mistake of burying key assumptions deep inside formula bars, making it nearly impossible for you—or an investor—to understand the logic driving your forecast.
The Art of Defining Your Assumptions
With your data plugged in and your file structured, the real magic begins: translating past performance into the core drivers of your future projections. This all happens in a dedicated 'Assumptions' or 'Drivers' tab, which will serve as the central control panel for your entire model.
This is where you document the key metrics that dictate your company's financial future. Instead of just guessing that next year’s revenue will be a certain number, you project the underlying drivers that produce that revenue. It's the difference between guessing the final score of a game and analyzing each team's stats to predict the outcome.
To make this manageable, your assumptions tab should be meticulously organized by category. Your model's integrity rests on these key inputs, so they need to be transparent and easy to adjust.
Below is a breakdown of the essential assumption categories you'll need to define for a robust model.
Key Assumptions for Your Financial Model
| Assumption Category | Example Metric | Typical Range (SaaS Example) | Why It Matters |
|---|---|---|---|
| Growth Drivers | Monthly Recurring Revenue (MRR) Growth | 5%-15% Month-over-Month | This is the primary engine of a subscription business, directly impacting top-line revenue forecasts. |
| Customer Metrics | Customer Churn Rate | 2%-5% Monthly | High churn can silently kill a business; modeling it shows how leaky your revenue bucket is. |
| Profitability | Gross Margin % | 70%-85% | Defines how much profit you make on each sale before accounting for operating expenses. |
| Operating Expenses | Sales & Marketing as % of Revenue | 20%-40% | Dictates your customer acquisition cost and overall burn rate. |
| Working Capital | Days Sales Outstanding (DSO) | 30-60 days | Measures how quickly you turn receivables into cash, a critical component of cash flow. |
| Capital Investment | Annual CAPEX Budget | $10k – $100k+ | Forecasts major investments in assets like servers or office equipment. |
By isolating these variables in a dedicated tab, you create a model that is both robust and flexible. It allows you to easily toggle inputs and see how changes in one area—like a 1% improvement in churn—ripple through the entire financial picture. This is the foundation for powerful scenario analysis, which we'll get to later.
Here are the essential drivers you’ll need to define:
- Growth Assumptions: Think year-over-year revenue growth rates, customer acquisition growth, and average revenue per user (ARPU).
- Profitability Assumptions: This starts with your Cost of Goods Sold (COGS) as a percentage of revenue, which determines your gross margin. You also need to forecast operating expenses like R&D, Sales & Marketing, and G&A, often as a percentage of revenue or based on headcount. Understanding the profitability of each customer is also crucial—dive deeper into that with our guide on what is unit economics.
- Working Capital Assumptions: This covers the operational nuts and bolts. You'll need assumptions for Days Sales Outstanding (DSO) to forecast how quickly you collect cash, and Days Payable Outstanding (DPO) for how quickly you pay suppliers.
- Capital Expenditures: How much do you plan to invest in property, plant, and equipment (PP&E)? Lay this out as a clear schedule.
Connecting the Dots: Building Your Core Statements
Now that your assumptions are dialed in, it’s time to build the engine of your 3 statement financial model. This is where the numbers stop being a static list of drivers and start telling the story of your business's future. We’ll walk through each statement one by one, focusing on the critical connections that make the entire model hum.
There's a reason for the sequence here. You have to start with profitability, then map out what you own and owe, and finally trace where the cash actually goes. It’s like building a car: you put the engine in first (Income Statement), then build the chassis and body (Balance Sheet), before finally hooking up the fuel lines that make it all run (Cash Flow Statement).
Projecting Your Income Statement
The income statement is the natural place to begin. It calculates your company's profitability, which is the single biggest driver for the other two statements. The goal is simple: project your revenue and all the costs that go with it, using the assumptions we just laid out.
Start at the top with revenue. Instead of just punching in a number, you'll build a formula that pulls directly from your 'Assumptions' tab. For a SaaS business, that formula might look something like this:
- (Previous Month's Customers + New Customers – Churned Customers) x Average Revenue Per User
This kind of bottom-up approach is what makes a model truly insightful. It creates a direct link between your day-to-day operations (like acquiring and keeping customers) and your financial results. From there, you just work your way down the P&L, calculating things like COGS and operating expenses by linking them to your revenue or headcount drivers. The final number, Net Income, is the crucial output that becomes the first major link into the other statements.
Building the Balance Sheet with Supporting Schedules
Next up is the balance sheet. A classic mistake is trying to forecast every single line item right on the balance sheet itself. That road leads to a messy, unauditable model. The pro-level move is to build out supporting schedules for any complex items, usually on separate tabs.
These schedules are where you do the heavy lifting for major balance sheet accounts. The key ones you'll want to build are:
- Property, Plant, & Equipment (PP&E) Schedule: This is where you track capital expenditures (CAPEX), calculate depreciation, and project the final PP&E balance for each period.
- Debt Schedule: Here, you'll model out any loans, including new debt you take on, scheduled principal repayments, and interest expense. That interest calculation will then flow back into your income statement.
- Equity Schedule: This tracks any changes in equity from issuing stock and, most importantly, it's where Net Income from the P&L gets rolled into Retained Earnings.
The balance sheet must always, always balance (Assets = Liabilities + Equity). Using supporting schedules is the secret to making sure it does. They isolate the complexity, which makes it infinitely easier to find an error when your numbers don't tie out.
By building these schedules first, you keep the main balance sheet itself clean and simple. Each line item on the balance sheet just becomes a straightforward link to the final, closing balance from its own schedule. This kind of structural discipline is what separates a rookie model from an institutional-grade one.
The Critical Links: The Cash Flow Statement
The cash flow statement is where it all comes together. Unlike the other two, this statement is almost entirely derived from the income statement and the changes on the balance sheet. It's the ultimate test to see if you've connected everything correctly.
You'll build it in three distinct sections:
- Cash Flow from Operations (CFO): You start with Net Income (pulled from the income statement). Then, you add back any non-cash expenses like Depreciation (from your PP&E schedule) and adjust for changes in working capital (which you calculate from the period-over-period changes in accounts like Accounts Receivable and Accounts Payable on the balance sheet).
- Cash Flow from Investing (CFI): This section is mostly driven by your CAPEX. When you buy new equipment, it's a cash outflow, and you'll pull that number directly from your PP&E schedule.
- Cash Flow from Financing (CFF): This tracks cash you bring in from raising debt or equity, and the cash you spend on repaying debt. These figures link directly from your debt and equity schedules.
Add those three sections up, and you get the Net Change in Cash for the period. When you add that to the Beginning Cash Balance from the last period's balance sheet, you get your Ending Cash Balance.
This final number is the moment of truth.
The calculated Ending Cash Balance on your cash flow statement MUST equal the Cash balance shown on your current period's balance sheet. If it does, your model is integrated. If not, you've got a broken link somewhere.
This final reconciliation—often called "tying out the model"—is the most important validation check you have. When you build a model this way, you can change a single assumption, like your sales growth, and trust that the impact will flow correctly through your profit, assets, debt, and right down to your final cash position. For a deeper dive, our complete guide to startup financial modeling provides more detailed examples.
Following a structured process like this is everything when it comes to accuracy. The Corporate Finance Institute, for example, has shown that building models step-by-step—from historical data to supporting schedules—can get error rates under 2%, particularly when using consistent timeframes like quarterly forecasts for startups. This precision is what turns a spreadsheet into a reliable strategic tool you can use to make critical business decisions.
Stress-Testing Your Strategy with Scenario Analysis
A static forecast is useful, but let’s be real—the moment you finish it, it’s already out of date. The real world is messy. A dynamic model that prepares you for the unexpected, however, is a true strategic asset.
Once your 3 statement financial model is built and balanced, its real power comes from answering all those "what-if" questions that keep you up at night. This is where you transform your forecast from a simple projection into a strategic sandbox.
By building in scenario and sensitivity analysis, you can pressure-test your plans and spot risks before they blow up. Think of it as the difference between having a single flight plan and having contingency plans for bad weather, engine trouble, and air traffic.
This is all possible because of how the three statements are intrinsically linked.
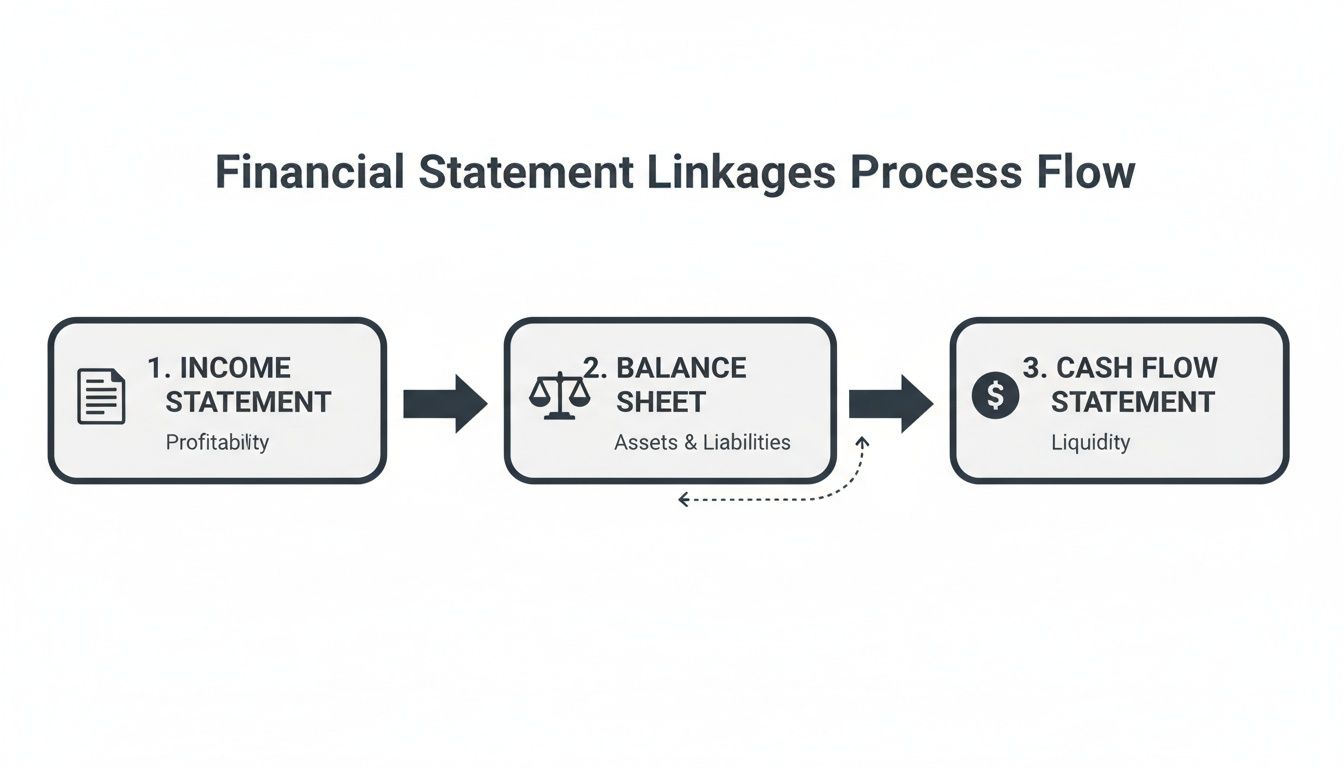

As you can see, net income from the income statement directly impacts both the balance sheet (via retained earnings) and the cash flow statement. This interconnectedness is what makes the whole model dance when you start tweaking your assumptions.
The Power of Scenario Toggles
The most effective way to run scenarios is by creating toggles for different operating cases—usually a 'Best Case,' 'Base Case,' and 'Worst Case.' This sounds more complex than it is. It's often just a simple drop-down menu on your 'Assumptions' tab that controls your key business drivers.
For instance, your assumptions for revenue growth, customer churn, and gross margin would have three different values tied to each case.
- Base Case: This is your best guess—the most realistic outcome based on your current data and trajectory.
- Best Case: An optimistic scenario where everything goes right. Your big initiatives pay off, market conditions are perfect, and growth accelerates.
- Worst Case: The pessimistic view. You model potential headwinds like losing a major client, a new competitor entering the market, or an economic downturn.
With this setup, you can instantly flip between scenarios and watch your entire model—from top-line revenue down to your final cash balance—update in real-time.
Asking the Right Strategic Questions
This is where your model transcends being a simple spreadsheet and becomes a tool for strategic finance. It gives you concrete, data-backed answers to the tough questions.
A great financial model doesn’t just tell you if your plan works; it tells you where your plan breaks. Scenario analysis is how you find those breaking points safely inside a spreadsheet.
Running these different cases helps you quantify risks and opportunities. Suddenly, you can answer critical questions like:
- Runway Impact: "In our worst-case scenario where we lose our biggest customer, how many months of cash runway do we really have left?"
- Hiring Decisions: "If we hire those three new developers, what does our cash burn look like in the base case versus the worst case?"
- Pricing Strategy: "How does a 10% price increase impact our bottom line and cash position in the best-case scenario, assuming we don't lose too many customers?"
De-Risking Your Financial Future
This kind of stress testing is absolutely essential for managing your cash. It’s one thing to see a positive cash forecast in your base plan, but it’s far more valuable to know exactly what happens when things go south. Some analyses suggest that businesses running best/worst-case projections can cut their liquidity risks by up to 40%.
The cash flow statement in your worst-case scenario might reveal a negative balance six months out, giving you a clear signal to secure a line of credit or adjust spending now, not when it’s too late. To dig deeper into the mechanics, Wall Street Prep offers some great insights on building these integrated models.
Ultimately, scenario analysis isn’t about perfectly predicting the future. It's about understanding the range of potential outcomes so you can build a more resilient business—one that can withstand challenges and pounce on opportunities. It turns your model into a living document and a strategic partner in your decision-making.
For many founders, the real challenge isn't just building the scenarios but translating them into actionable steps. This is a key area where an experienced fractional executive can add immense value, helping you not only model the future but strategize the right response to whatever it holds.
How to Validate and Use Your Financial Model
A financial model with a hidden error is far more dangerous than no model at all. It gives you a false sense of security, which can lead to disastrous decisions on hiring, spending, and fundraising. Before you put your model to work, you need to be absolutely sure it’s accurate and reliable.
This whole validation process isn't just about double-checking formulas; it's about making sure the story your model tells is both mathematically sound and grounded in the reality of your business. Think of it as a mix of technical, mechanical checks and strategic "sense-checking."
The Non-Negotiable Technical Checks
First things first, you have to confirm the mechanical integrity of the model. Certain things in a 3 statement financial model simply have to work perfectly, every single time. If they don't, it’s a massive red flag that a fundamental link is broken somewhere.
Here’s a practical checklist to run through:
- Does the Balance Sheet Balance? This is the golden rule. Your total assets must always equal your total liabilities plus shareholders' equity. For every single period. If it's off by even a penny, you need to hunt down the source of the error. No exceptions.
- Does the Cash Flow Tie Out? The ending cash balance you calculate on your statement of cash flows has to perfectly match the cash line item on that period's balance sheet. This check is crucial because it confirms that all three statements are properly integrated.
- Are Your Links Consistent? Take a moment to scan your formulas. You should almost never "hard-code" numbers that should be calculations. For example, depreciation expense on the income statement should be a formula linked directly from your PP&E schedule, not a number you typed in manually.
A common and frustrating mistake is a "circular reference" error, where a formula refers back to its own cell. This can completely break your model. A frequent culprit is linking interest expense (on the income statement) to a debt balance that is itself affected by net income.
The Art of the Sense-Check
Once the mechanics are solid, it's time to step back and ask the most important question: "Do these numbers actually make any sense?" This is where your business acumen meets the spreadsheet logic. You're hunting for outputs that seem unrealistic or completely out of whack with industry norms.
Ask yourself these kinds of questions:
- Are your growth rates realistic? Is your model projecting 150% year-over-year revenue growth for the next five years straight? While that's an ambitious goal, is it truly achievable in your market without a ridiculously exponential increase in marketing spend? Be honest.
- How do your margins stack up? If your model shows projected gross margins of 95% in an industry where the average is closer to 65%, you'd better have a revolutionary, defensible reason for that gap. Always compare your key metrics to industry benchmarks.
- Does the cash flow narrative align with your strategy? If you’re in a heavy growth phase, it's perfectly normal—even expected—to see negative cash from operations as you pour money into inventory and talent. But if your model shows massive positive cash flow while you’re supposedly scaling aggressively, something is likely off in your assumptions.
Putting Your Validated Model to Work
With a validated, sense-checked model, you now have an incredibly powerful tool for strategic decision-making. Its real value goes far beyond just a pretty chart in a pitch deck.
Here are the primary ways you'll use it:
- Fundraising: This is the most obvious one. A well-built model gives investors confidence that you truly understand the drivers of your business and can map out a credible path to profitability and, for them, a return on their investment.
- Strategic Planning: Use your scenario analysis to make smarter, faster decisions. Before you commit a single dollar, you can determine the impact of a major product launch or entering a new market on your cash runway and profitability.
- Operational Budgeting: The model becomes a clear financial framework for your department heads. It translates your high-level strategic goals into tangible monthly or quarterly budgets for marketing, sales, and R&D that everyone can work towards.
Ultimately, this entire process transforms your model from a simple academic exercise into a core asset for making smarter, data-driven decisions. For many founders, the real challenge isn't just building the spreadsheet, but interpreting the outputs and connecting them to strategy. An experienced fractional CFO doesn't just build the model; they help you use it to navigate the path to growth.
Common Questions About Financial Modeling
Even with a detailed guide in front of you, jumping into a 3-statement financial model for the first time is going to spark some questions. Let’s tackle some of the most common ones we hear from founders so you can sidestep the usual headaches.
What Is the Hardest Part of Building the Model?
For almost everyone, the biggest hurdle is getting the three statements to link up perfectly. The moment of truth—and often, frustration—is that final step of making sure the balance sheet actually balances.
This is where meticulous, almost obsessive, attention to detail pays off. A single broken formula, like forgetting to link depreciation from the PP&E schedule back to both the income statement and cash flow statement, can throw the entire model into chaos. Think of it like a puzzle where every single piece must fit perfectly.
How Often Should I Update My Financial Model?
For any early-stage or high-growth company, a static annual model just won't cut it. The best practice is to update your forecast with actual results every single month.
This monthly rhythm is non-negotiable. It lets you run a budget vs. actual (BvA) analysis, which is really just a structured way of seeing how your plan stacked up against reality. This process forces you to constantly revisit your assumptions, turning your model from an old, dusty artifact into a living, breathing tool for making real-time decisions.
Can I Build This Without a Finance Background?
Yes, you can absolutely build a technically correct model with a solid template and a step-by-step guide. But the real magic isn’t just in building it—it's in understanding what the outputs are telling you so you can make smarter strategic moves.
This is where deep financial expertise really shines. An expert doesn't just see numbers on a spreadsheet; they see the story behind them. They know which levers to pull and what "what-if" questions to ask to turn that data into a concrete, actionable plan for growth.
What Are the Most Common Mistakes to Avoid?
Beyond simple formula errors, there are a few strategic blunders that can completely torpedo your model's credibility. Knowing what they are from the get-go will save you a world of pain later.
- Hard-coding inputs: This is a classic rookie mistake. Never type a number directly into a formula cell if it's an assumption. Every driver should live in a dedicated 'Assumptions' tab and be linked from there. This way, you can tweak one number and watch the entire model update instantly.
- Wildly optimistic assumptions: Nothing screams "I don't know my business" louder than a forecast that’s all hockey-stick growth with no basis in reality. Always gut-check your numbers against industry benchmarks and, more importantly, your own historical data.
- Forgetting about working capital: It's easy to get fixated on revenue and profit. But many founders learn the hard way that the timing of cash—when you collect from customers versus when you pay your bills—can make or break you. You absolutely have to model things like Days Sales Outstanding (DSO). It's not optional.
Building a proper 3-statement financial model is a huge leap in strategic maturity. But let's be honest, if the process is pulling you away from actually running your business, it’s probably time to call in some expert help.
A fractional finance executive can not only build an institutional-grade model for you but also act as the strategic partner who helps you use it to drive growth, nail your fundraising pitch, and navigate the road ahead with confidence. Ready to see how fractional leadership can make a difference? Explore our network of vetted fractional executives and schedule a consultation today at https://useshiny.com.