


Running a startup often feels like you're navigating a dense fog with only a gut feeling as your compass. Think of business intelligence (BI) for startups as your GPS. It cuts through the uncertainty with real-time data, transforming raw info from sales, marketing, and product into clear, actionable insights.
Suddenly, every move you make is calculated and purposeful.
Why Business Intelligence Is Your Startup's Co-Pilot


In the early stages, founders juggle a dozen roles and make hundreds of decisions a day. Without a solid data foundation, these decisions are reactive shots in the dark. Business intelligence completely flips this dynamic.
Instead of waiting for month-end reports to piece together what happened, you get a live view of your company’s health.
This isn't about getting lost in massive spreadsheets. Modern BI is about accessibility and speed. It puts data into the hands of everyone on your team—not just analysts—so they can answer critical questions on the fly.
Imagine your marketing lead instantly seeing which ad campaign is crushing it. Or your product manager pinpointing the exact screen where users drop off in your app. That's the power of accessible BI.
From Guesswork to Growth Engine
Adopting a BI mindset early gives you crucial advantages for survival and growth. For starters, it helps you protect your most precious resource: cash. By understanding customer behavior and sales trends, you can allocate your budget with surgical precision—doubling down on what works and killing what doesn't.
A smart BI strategy lets your team:
- Validate Ideas Faster: Test hypotheses about your product or market with actual data, not just assumptions. This is how you find product-market fit before you run out of runway.
- Improve Operational Efficiency: Spot bottlenecks in your processes, from sales cycles to customer support tickets, and make targeted improvements that save serious time and money.
- Align the Entire Company: Create a single source of truth that gets everyone pulling in the same direction. When the whole team is focused on the same core metrics, you start moving much faster.
By transforming raw numbers into a clear narrative, BI ensures that every strategic conversation is grounded in reality. This approach is fundamental to building a resilient, adaptable, and ultimately successful startup.
Ultimately, integrating business intelligence is how you build a data-driven culture. To dive deeper into this foundational concept, check out our guide on the principles of data-driven decision-making.
You don't need a massive budget or a full-time data scientist to get started. You just need a clear plan.
Defining the Metrics That Actually Matter
Before you touch a dashboarding tool, you need to get crystal clear on what story you want your data to tell. For startups, effective business intelligence isn't about tracking every single data point. It’s about zeroing in on the vital few that are true signals of business health.
Many founders fall into the trap of measuring vanity metrics—things like website traffic or social media follows. These are activity metrics, not progress metrics. They don't directly impact the bottom line.
The first, most critical step is moving from a fuzzy goal like "get more users" to a razor-sharp Key Performance Indicator (KPI). This means locking in your North Star Metric—the one single metric that best captures the core value your product delivers to customers.
From North Star to Supporting KPIs
Once you've got your North Star, the real work begins: identifying the supporting KPIs that actually move it. These are the levers your team can pull every day to drive growth.
Think of it like a doctor monitoring a patient's health. The overall goal is wellness (your North Star), but they track specific vitals like heart rate and blood pressure (your supporting KPIs) to understand what’s really going on.
For example, a B2B SaaS company obsessed with reducing churn needs to be tracking things like:
- Customer Engagement Score: A composite score showing how actively users are interacting with key features.
- Net Promoter Score (NPS): A classic indicator of customer satisfaction and loyalty.
- Support Ticket Resolution Time: A direct reflection of how effective your customer service is.
Each of these KPIs provides a clear signal, telling you exactly where to focus your energy. For a deeper dive, check out our guide on choosing the right key performance indicators for your startup.
The goal is to build a clear hierarchy of metrics. Your North Star sets the direction, and your supporting KPIs create the tactical roadmap. This ensures every person on your team understands how their daily work contributes to the bigger picture.
The sheer volume of data being created is staggering—it's expected to hit 175 zettabytes by 2025. Research shows that organizations with high BI adoption are five times more likely to make faster, better-informed decisions and see an average ROI of 112%. You can read the full research on business intelligence statistics on scoop.market.us.
Getting your metrics right from the start is how you tap into that value and turn data into insight.
Building Your BI Tech Stack Without Breaking the Bank
Okay, you know which metrics matter. The next big question is: which tools should you use?
The world of business intelligence software can feel overwhelming, with enterprise platforms flashing enterprise-level price tags. But here’s the thing: building a powerful BI tech stack doesn’t have to drain your startup's runway.
The trick is to think in components and start with lean, scalable solutions. Your first stack really only needs three core layers. By picking platforms with generous free tiers, you can build a professional-grade setup for a fraction of the traditional cost.
The Three Pillars of a Startup BI Stack
Think of your BI stack like building with LEGOs. You start with a solid base (your data warehouse), connect pieces from different sets (your integration tool), and then build something everyone can understand (your visualization tool).
Here’s a practical look at each layer:
- Data Warehouse: This is your central command center. Stop pulling data from messy spreadsheets and consolidate everything in a warehouse like Google BigQuery or Snowflake. Many offer huge free credits to get you started.
- Data Integration (ETL/ELT): Your data is scattered everywhere—Stripe, HubSpot, Google Analytics. An integration tool like Fivetran or the open-source Airbyte acts as the plumbing, automatically pulling data into your warehouse.
- Data Visualization: This is where the magic happens. Tools like the open-source Metabase or Google's Looker Studio connect to your warehouse and turn raw data into interactive dashboards.
This setup brings your metrics hierarchy to life, making your core business goals, KPIs, and North Star Metric visible to the entire team.
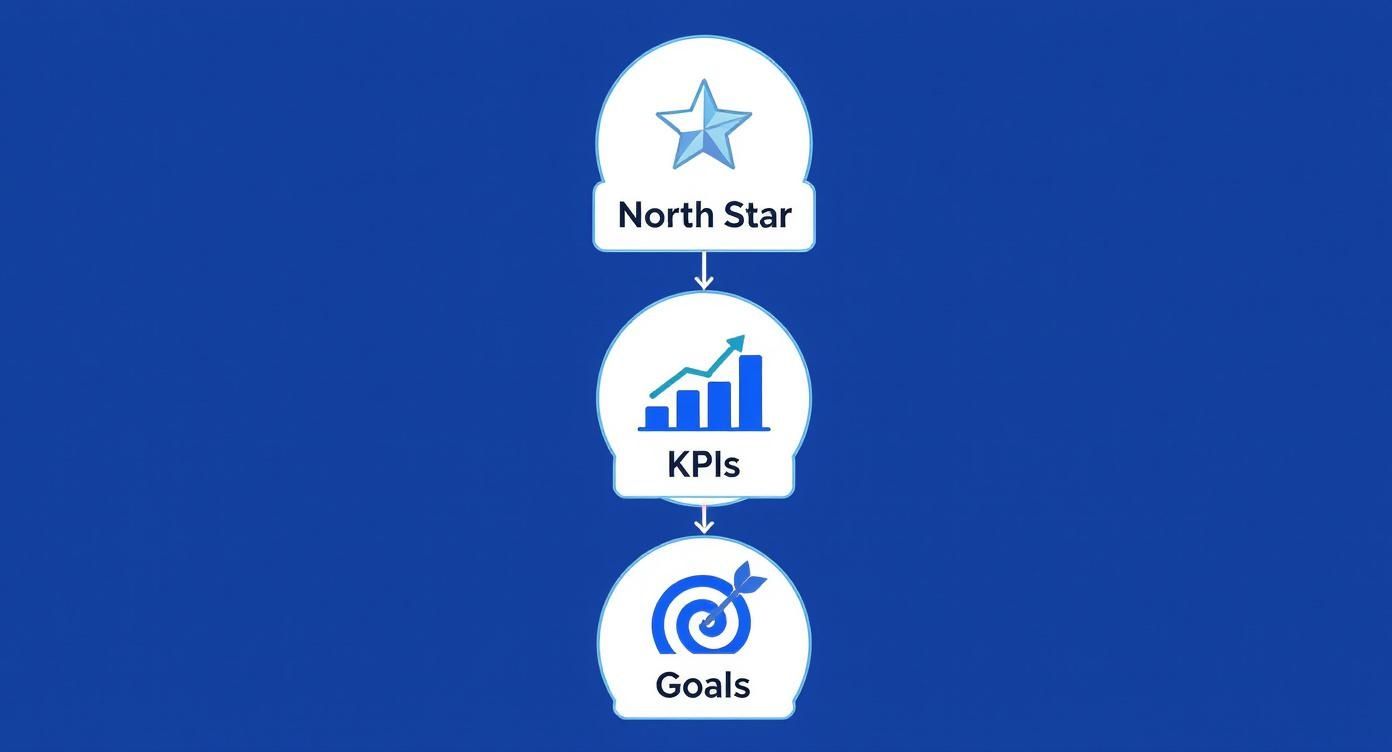

As the infographic shows, your tools need to connect the dots from high-level strategy down to the specific actions your team takes every day.
Comparison of BI Visualization Tools for Startups
Choosing the front-end tool—what your team will use daily—is a critical decision. You want something powerful enough for real insights but simple enough for everyone to adopt.
| Tool | Ideal For | Pricing Model | Key Features |
|---|---|---|---|
| Looker Studio | Teams already in the Google ecosystem looking for a free, powerful tool. | Free | Native integration with Google products, drag-and-drop report builder, easy sharing. |
| Metabase | Startups wanting a user-friendly, open-source option with great self-serve analytics. | Open-source (free), with paid cloud and enterprise plans. | Simple question-builder for non-technical users, clean dashboards, strong community support. |
| Tableau Public | Individuals or teams needing to create rich, shareable visualizations for public use. | Free, but workbooks are public. Paid versions for private data. | Industry-leading visualization capabilities, powerful data exploration, large community. |
| Power BI | Companies heavily invested in the Microsoft ecosystem (Azure, Office 365). | Freemium model with a free desktop version; Pro version is affordable. | Deep integration with Excel and other Microsoft tools, robust data modeling. |
The "best" tool depends entirely on your team's skill, budget, and existing systems. Start with a free tool like Looker Studio or Metabase and see how far it takes you.
Making the Right Choice for Your Stage
I've seen so many startups get this wrong. The biggest mistake is picking a platform that’s too simple, which you’ll outgrow in six months, or one that’s way too complex, burning cash you desperately need elsewhere.
The goal is to select tools that can grow with you. A stack built on a scalable warehouse like BigQuery ensures that as your data volume increases, your BI capabilities can easily keep pace. This avoids a costly migration later on.
Making these technical decisions can be daunting. An experienced fractional leader can help you select and implement the perfect-fit tools, ensuring you build a data infrastructure that supports your growth instead of holding it back.
Crafting Dashboards That Drive Action
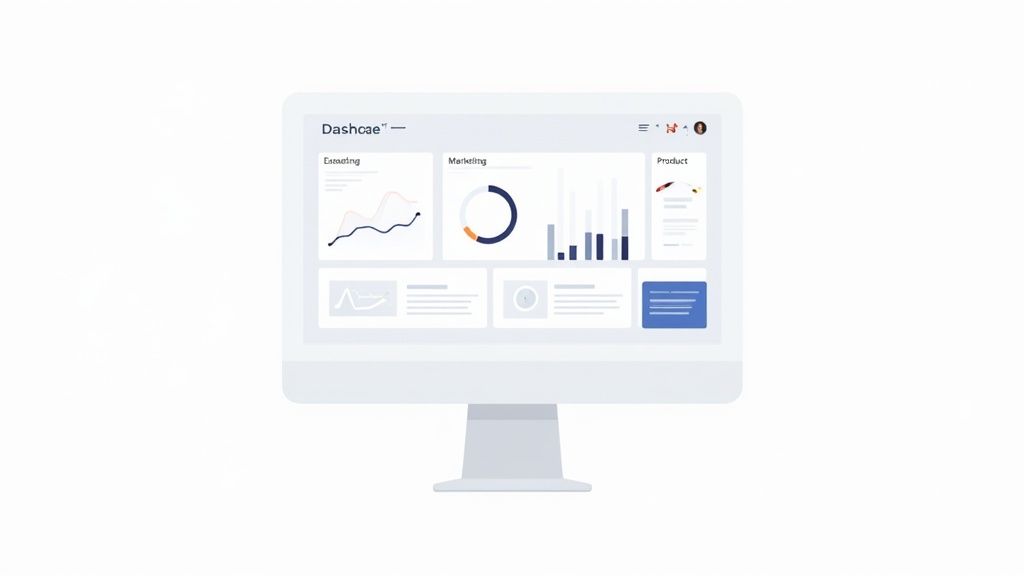
Here's a hard truth: a dashboard packed with charts isn't insight. It's just noise. The magic of business intelligence for startups happens when dashboards tell a clear story that triggers a specific decision.
Instead of building one massive "everything" dashboard, start with three distinct views. Each should be built for a specific audience and designed to answer a core set of questions about their part of the business.
Your First Three Essential Dashboards
Think of it like building dashboards for different altitudes. The CEO needs the 30,000-foot view, but the marketing lead needs to be on the ground, digging into campaign-level details.
-
The Executive Overview: This is your mission control. It needs your North Star Metric at the top, supported by high-level KPIs like Monthly Recurring Revenue (MRR), Customer Acquisition Cost (CAC), and cash runway. The goal is to see the health of the business at a glance. For some great ideas, check out these powerful executive dashboard examples.
-
The Marketing Performance Deep-Dive: This dashboard answers one question: "Is our marketing spend working?" Track metrics like leads by source, conversion rates, and CAC broken down by channel. This view empowers your marketing team to optimize your budget in near real-time.
-
The Product Engagement Monitor: This is where you find out if customers are getting value from your product. Focus on metrics like Daily Active Users (DAU), feature adoption rates, and user retention cohorts. This dashboard helps your product team identify sticky features and pinpoint where users get stuck.
A great dashboard doesn't just present numbers; it answers the next logical question. If you show a dip in user sign-ups, the dashboard should also offer a view into which marketing channel underperformed. Always design for the "why" behind the "what."
By creating these distinct, action-oriented dashboards, you turn data from a passive report into an active co-pilot for your strategic conversations.
The Strategic Advantage of Fractional BI Leadership

You’ve defined your metrics and picked a tech stack. But now the real work begins: turning that potential into a sustainable, data-driven culture. This is where most startups hit a wall. They have the tools but lack the strategic oversight to weave data into their daily operations.
The reality is, most early-stage companies can’t justify the $200,000+ annual salary for a full-time Head of Analytics. But they desperately need that senior-level expertise to build a solid data foundation and mentor their team. This is the exact gap that fractional leadership fills perfectly.
A fractional BI leader is a part-time executive who brings C-suite-level strategic thinking for a fraction of the cost. They become a core part of your team, typically working 5 to 25 hours a week to set the vision and help you execute it.
Beyond the Dashboard: An Expert on Your Team
Hiring a fractional expert is like bringing in an experienced architect to design your house's blueprint before you start building. They make sure your data infrastructure is built right the first time.
A great fractional BI leader will:
- Architect Your Data Strategy: They help you craft a real data strategy that aligns your BI roadmap with your biggest business goals.
- Mentor Your Junior Talent: They can upskill your existing team, teaching them best practices in analysis and visualization.
- Establish Data Governance: They put processes in place to ensure your data stays clean, reliable, and secure as you scale.
- Champion a Data-Driven Culture: They help shift the company mindset from "gut-feel" to data-informed.
This model is a game-changer. The BI software space is a $33.6 billion industry, with new AI-powered tools popping up constantly. An expert guide can help you navigate this space. To see what's happening on the bleeding edge, check out these insights on AI business intelligence startups.
Asking the Right Questions to Find Your Partner
Finding the right fractional partner is less about their mastery of a specific tool and more about their business savvy. You need someone who has seen this movie before and knows how to guide a startup through growing pains.
The real value of a fractional leader isn't just their ability to build a chart. It’s their ability to ask the tough questions that force your leadership team to think critically and translate complex data into a simple story that everyone can act on.
When vetting a potential fractional BI leader, focus on strategic questions:
- How would you approach our first 90 days to deliver the biggest impact?
- Can you share an example of when you used data to pivot a company’s strategy?
- How do you ensure the BI initiatives you lead actually get adopted by the wider team?
Choosing fractional leadership gives your startup the strategic firepower of a seasoned executive without the financial weight. It’s the smartest way to speed up your time-to-insight and build a company that truly runs on data.
Common Questions About Startup BI
Even with a solid plan, jumping into business intelligence can feel like a big leap. Most founders wrestle with the same few questions before they get started.
When Is the Right Time to Invest in Business Intelligence?
The short answer? Probably sooner than you think.
The best time to start is as soon as you have consistent data coming from your core systems—your CRM, payment processor, or product analytics tool. Starting early helps you avoid piling up "data debt," the messy, disorganized data that becomes a nightmare to clean up later.
What Are the Biggest BI Mistakes Startups Make?
Founders tend to step into the same costly traps. Just knowing what they are is half the battle.
- Buying the Tool Before the Plan: Getting wowed by a flashy BI tool before you’ve figured out your goals and KPIs.
- Chasing Vanity Metrics: Focusing on numbers that look good but don't mean anything for the business, like page views or social media likes.
- Treating BI as a One-Time Project: Thinking you can just "set it and forget it." Real business intelligence is a living process of constant refinement.
This is exactly where a fractional expert can save you a world of hurt. Their experience helps you sidestep these common traps, making sure your investment in BI actually pays off from day one.
Can We Do This Without a Dedicated Data Analyst?
Absolutely, especially when you're just starting. Modern self-service BI platforms like Looker Studio and Metabase are built for non-technical folks. They empower anyone on your team to dig into the data.
As your needs grow, a fractional BI leader can provide the expert guidance to scale your setup without the full-time cost.
How Do We Build a Data-Driven Culture?
This has to start at the top. It’s all about weaving data into the daily rhythm of your company.
Make it a habit to pull up dashboards in team meetings. When you’re making a strategic point, back it up with a chart or a key metric. Give everyone access to the data and celebrate wins that came from a specific insight.
When you do this, data stops being a tool for judging performance and becomes a shared asset that helps everyone succeed together.
Building a solid data foundation is one of the most strategic moves you can make, but you don’t have to figure it all out on your own. Shiny connects startups with a network of vetted, fractional executives who provide the expert BI leadership needed to grow faster. If you're ready to make data your competitive advantage, we can help you find the right strategic partner for your journey.
Explore our marketplace or schedule a consultation today to connect with a fractional BI expert.