


A SaaS founder leaves a board meeting with a familiar problem. The revenue chart is backward-looking, pipeline coverage looks healthy on paper, and the team has plenty of activity to report. Yet nobody can answer a practical question: How quickly is the current pipeline turning into revenue, and did this week's work improve that speed?
That's the problem sales velocity solves. It combines qualified opportunities, average deal value, win rate, and sales cycle length into one daily revenue flow rate. The metric doesn't replace revenue, pipeline coverage, or conversion reporting. It gives those measures a common operating context.
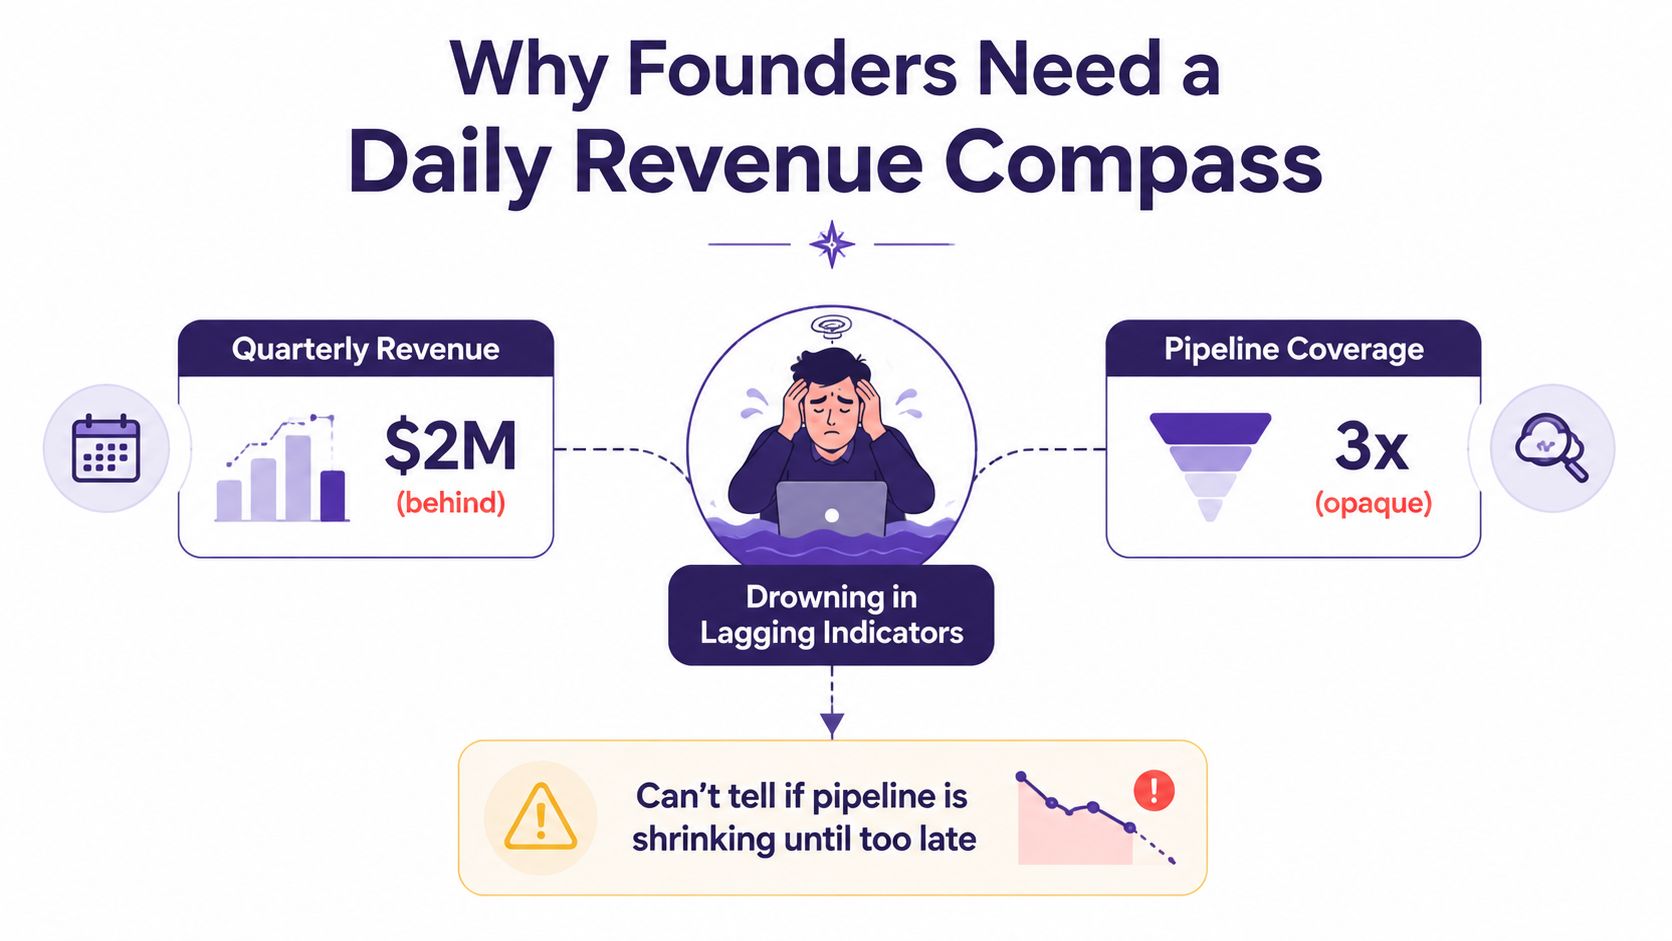
Why Founders Need a Daily Revenue Compass
Quarterly revenue tells you what already happened. Pipeline coverage tells you how much potential business exists, but not how efficiently that potential is converting. A founder can watch both metrics and still miss a slowing sales engine until the next forecast call.
Sales velocity acts like a daily compass. The standard calculation combines four operating drivers into a single figure representing revenue generated per day: qualified opportunities, average deal size, win rate, and sales cycle length. The result isn't a deal count or a percentage. It's a rate that helps you see how quickly pipeline becomes cash.

Practical rule: If the number changes, ask which of the four inputs changed. That question turns a vague revenue concern into an operating investigation.
Why one number helps leadership decisions
The metric gives early and mid-stage companies a way to connect daily sales actions with broader decisions:
- Forecasting: A daily revenue rate offers a more useful view of pipeline productivity than a static opportunity total.
- Prioritisation: Leaders can focus on the bottleneck that suppresses revenue, whether that's weak qualification, small deals, low conversion, or delays.
- Hiring: A founder can assess whether additional sellers are needed or whether the existing process is leaking value first.
- Investment timing: Changes in velocity can inform decisions about marketing spend, sales tooling, and leadership capacity.
The metric also prevents a common mistake: assuming more pipeline automatically means more revenue. Two teams can hold similar pipeline values, while the team with stronger conversion and shorter cycles produces revenue faster.
You'll learn the formula, how each lever works, how to interpret worked examples, and which operating habits improve the number. You'll also see where a fractional sales leader can install the measurement discipline and repeatable process a startup often lacks.
The Sales Velocity Formula Explained
The formula is:
(Number of Qualified Opportunities × Average Deal Value × Win Rate) ÷ Sales Cycle Length in Days = Sales Velocity
Each input answers a different question about the commercial engine.
Number of qualified opportunities
This is the number of active opportunities that meet your qualification standard. It isn't every contact, form fill, or person who downloaded an asset. Think of it as the number of live fish in a pond. A larger pond can produce more revenue, but only if the fish are real prospects and the team can reach them.
Average deal value
Average deal value is the typical revenue attached to a won opportunity. In the fishing analogy, it's the size of each fish. A team selling larger, better-packaged solutions can raise this input without adding more opportunities, provided the additional value is relevant to the buyer.
Win rate
Win rate is the share of qualified opportunities that become customers. It represents how many bites land. In the formula, use the rate as a decimal, so a stated win rate of 25% becomes 0.25.
Sales cycle length
Sales cycle length is the average number of days from the defined opportunity start point to a closed deal. It describes how quickly the line moves from the first meaningful stage to revenue. Because this value is the denominator, reducing unnecessary delay increases velocity.
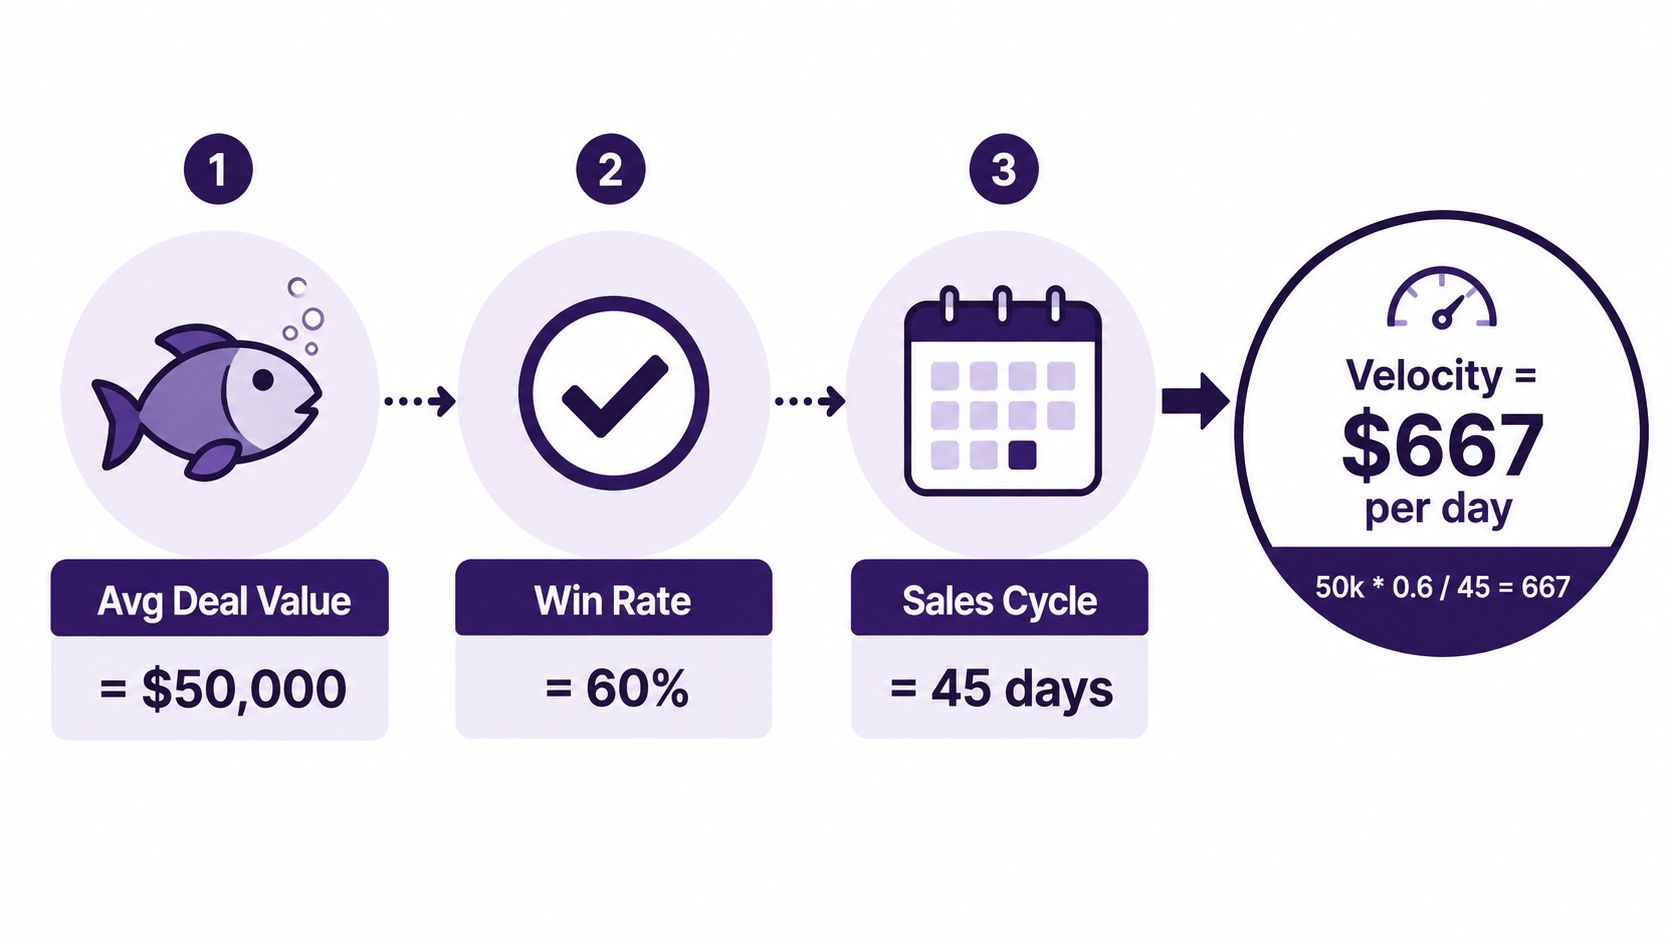
Using the example shown in the graphic, a $50,000 average deal value, a 60% win rate, and a 45-day sales cycle produce approximately $667 per day, calculated as $50,000 × 0.60 ÷ 45. The number of opportunities would multiply that rate when included in the full formula.
The output is a daily revenue flow rate, not a percentage.
Use a consistent time window for all inputs. If your opportunity count reflects this month, your win rate comes from a comparable period, and your deal value and cycle length reflect current selling conditions. Pulling each input from a different period can make the result look precise while describing no real operating state.
Your CRM should be the primary source for opportunity stages, values, outcomes, and dates. Clean stage definitions matter because a loose opportunity count inflates the numerator, while inconsistent close dates distort the denominator. For related startup metrics, Shiny's guide to key performance indicators for startups provides useful context for building a broader measurement system.
The Four Levers That Move the Number
Sales velocity is useful because the formula shows exactly where improvement can come from. Consider a shared baseline of 100 qualified opportunities, a $10,000 average deal value, a 20% win rate, and a 50-day sales cycle. That produces $4,000 per day.
Each lever changes the result differently:
- Deal value: Raise the average contract through packaging, relevant upsells, or value-based pricing. A 10% increase takes the average deal to $11,000 and lifts daily velocity to $4,400.
- Win rate: Improve qualification, discovery, demonstrations, and mutual action plans. A 10% relative increase takes the win rate to 22% and lifts velocity to $4,400.
- Opportunities: Add qualified opportunities through outbound, partnerships, or inbound demand. A 10% increase takes the count to 110 and lifts velocity to $4,400.
- Cycle length: Remove approval delays, automate handoffs, and define follow-up expectations. A 10% reduction takes the cycle to 45 days and lifts velocity to approximately $4,444.
The arithmetic makes an important distinction. A relative improvement of 10% in a numerator lever produces the same proportional lift when the other inputs remain constant. A reduction in the denominator can produce a different result because the new denominator changes the division directly.
| Lever Adjusted | Baseline Input | Adjusted Input | Resulting Daily Velocity |
|---|---|---|---|
| Average deal value | $10,000 | $11,000 | $4,400 |
| Win rate | 20% | 22% | $4,400 |
| Qualified opportunities | 100 | 110 | $4,400 |
| Sales cycle length | 50 days | 45 days | Approximately $4,444 |
A 20% cut in cycle time, from 50 days to 40 days, would produce $5,000 per day under the same baseline. That doesn't mean cycle time is always the best lever. Cutting days by rushing poorly qualified deals can reduce win rate and damage the overall result.
Match the lever to the bottleneck
If sellers have too few qualified opportunities, improving follow-up won't create enough volume. If the pipeline is full but deals stall in approval, more prospecting can worsen the burden on the team. If average deal value is low because reps sell a narrow package, better qualification alone may leave revenue on the table.
Review each input against its historical trend, segment, and stage definitions. Then choose one primary experiment, rather than asking the team to improve everything simultaneously.
Worked Examples and Real Benchmarks
The formula becomes clearer when two contrasting SaaS models sit beside each other.
Company A is a mid-market startup with 200 open opportunities, a $15,000 average deal value, a 25% win rate, and a 60-day sales cycle. Its calculation is:
(200 × $15,000 × 0.25) ÷ 60 = $12,500 per day
Company B is a smaller self-serve SaaS business with 800 opportunities, a $1,200 average deal value, an 8% conversion rate, and a 21-day cycle:
(800 × $1,200 × 0.08) ÷ 21 = approximately $3,657 per day
These examples demonstrate why opportunity count alone is a weak health signal. Company B has more opportunities, but Company A produces a higher daily revenue flow because its deal value and win rate are stronger, even with a longer cycle.
The supplied examples also show why you should verify every input before comparing businesses. A self-serve pipeline may contain many lower-value opportunities, while a mid-market pipeline may contain fewer opportunities that require more approval and coordination.
External reference points
A 2026 benchmark cited by Monday's sales velocity overview reports average sales velocity of about $8,219 per day across 939 B2B companies, alongside a median sales cycle of 84 days. These figures are reference points, not universal targets.
Segment context matters. A 2026 benchmark from Zendesk's sales velocity guide places SMB pipeline velocity at roughly $4,500 to $7,000 per day and mid-market velocity at approximately $12,000 to $18,000 per day. Use these ranges as directional comparisons, not promises.
A diagnostic checklist
Ask:
- Are your opportunities qualified?
- Does your average deal value reflect current packaging and pricing?
- Is win rate calculated from the same opportunity definition?
- Does cycle length start and end at consistent stages?
- Does your result fit your segment, or does a specific input explain the difference?
A benchmark can tell you where to investigate. It can't tell you which change your business should make first.
Strategies to Measure and Improve Sales Velocity
Improvement works best as a sequence. Start with process, make the data trustworthy, add tools where they remove repeatable work, then adjust team responsibilities.
First, standardise the sales process
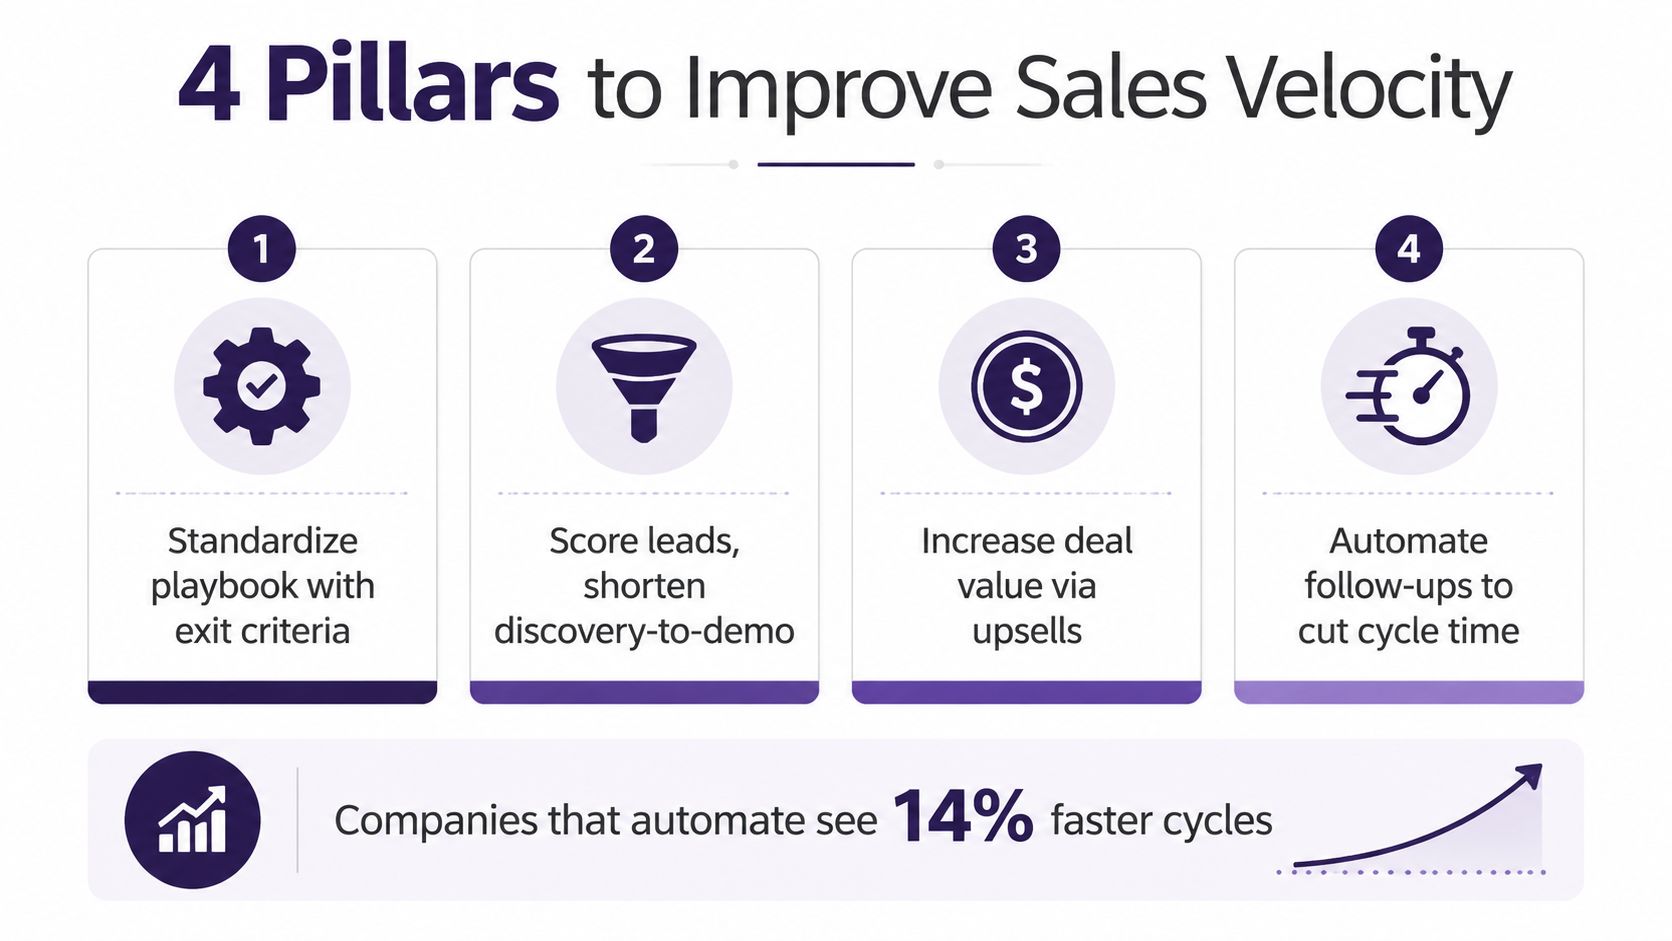
Define what a deal must prove before it advances. Stage exit criteria should include the buyer's problem, decision process, commercial fit, and next agreed action. A CRM stage shouldn't mean “the rep feels positive.” It should represent evidence.
Reduce the delay between discovery and demonstration by deciding what information the seller must collect first. Standardise proposal templates and follow-up cadences so each qualified opportunity receives the next action without relying on memory.
Second, instrument the four inputs
Create CRM fields for opportunity qualification, expected value, stage entry dates, close outcomes, and loss reasons. Build a dashboard that shows the four velocity inputs separately, then review the combined number weekly.
Track cohorts by segment, product, source, and seller. A blended number can hide a fast-moving segment that deserves more attention or a slow segment that needs a different process.
A weekly velocity review should end with one owner, one bottleneck, and one test.
Use the review to answer operational questions:
- Which stage adds the most waiting time?
- Which source creates opportunities that close?
- Which package produces the strongest deal value?
- Which loss reason appears often enough to change enablement?
Third, add tooling with a job to do
Lead scoring can help sellers focus on opportunities that meet your fit and buying criteria. Conversation intelligence can reveal whether discovery calls uncover business impact and decision process. Sales engagement tools can automate appropriate reminders, while forecasting tools can expose stale opportunities and unsupported close dates.
Don't purchase technology before defining the behaviour it should improve. Automation can't repair an undefined stage or an inflated opportunity count.
For a practical view of the funnel mechanics behind these changes, Shiny's sales funnel optimization guide is a relevant companion resource.
Fourth, fix organisational friction
Clarify the handoff between SDRs, account executives, marketing, and customer-facing teams. Marketing should understand which opportunities become revenue, not only which campaigns create attention. Sales leaders should define who owns stalled deals and how quickly the next action must happen.
The strongest improvement plan usually starts with the constraint that has the clearest evidence. Your team might need more qualified opportunities, but it might instead need stronger discovery, better packaging, or fewer internal approvals.
How a Fractional Sales Leader Accelerates the Gains
A founder can calculate sales velocity in a spreadsheet. Installing the operating system around it is harder. Someone must define the opportunity standard, clean the CRM, coach sellers, inspect deal quality, and hold the weekly review when other priorities compete for attention.
A fractional sales leader can fill that gap without making a permanent executive hire immediately. Through a marketplace such as Shiny, a company can connect with an experienced sales executive for a defined engagement and scope.
Three situations where the model fits
A stalled pipeline needs diagnosis. The leader audits opportunity stages, close dates, qualification fields, loss reasons, and forecast assumptions. The output is a defensible baseline and a short list of bottlenecks.
The company needs its first repeatable playbook. A fractional leader can define stage exit criteria, discovery questions, proposal rules, handoff ownership, and manager inspection habits before a full-time sales executive joins.
The board wants a focused improvement sprint. A 90-day programme can establish weekly coaching, deal reviews, forecast discipline, and experiments focused on the most impactful input.
The deliverables should be concrete:
- A documented sales velocity baseline
- A 90-day improvement plan
- Defined leading and lagging KPIs
- CRM field and dashboard requirements
- A hiring scorecard for the eventual full-time leader
Senior leadership doesn't have to begin with a permanent title. It can begin with a measurable operating mandate.
Fractional leadership is also becoming a broader talent model. An industry report says the number of fractional professionals in the United States doubled from 60,000 in 2022 to 120,000 in 2024 (ExecRoster). A separate market summary places the global fractional executive market at about $5.7 billion in 2025, with growth of roughly 14% annually (ExecRoster market statistics). More than 30% of midsize enterprises are projected to have at least one fractional executive on retainer by 2027, according to Gartner projections cited by Vendux.
The value isn't only access to time. A compiled market report says 72.8% of fractional professionals have 15 or more years of experience (Over 50 Pros market report). That depth can help a startup buy judgement and structure while keeping the engagement aligned with its immediate needs.
Turning Sales Velocity Into a Growth Engine
A founder reviews the pipeline on Monday and sees plenty of activity, yet the forecast still feels uncertain. Sales velocity turns that concern into a weekly management routine. Use the baseline to choose one constraint, assign an owner, and test a focused change before the next review.
During the first week, agree on what counts as a qualified opportunity, confirm that each opportunity has a value and stage, and record the dates that define cycle time. Then compare the resulting number with recent closed-won performance. This prevents a common mistake: improving the spreadsheet while the team records inconsistent pipeline data.
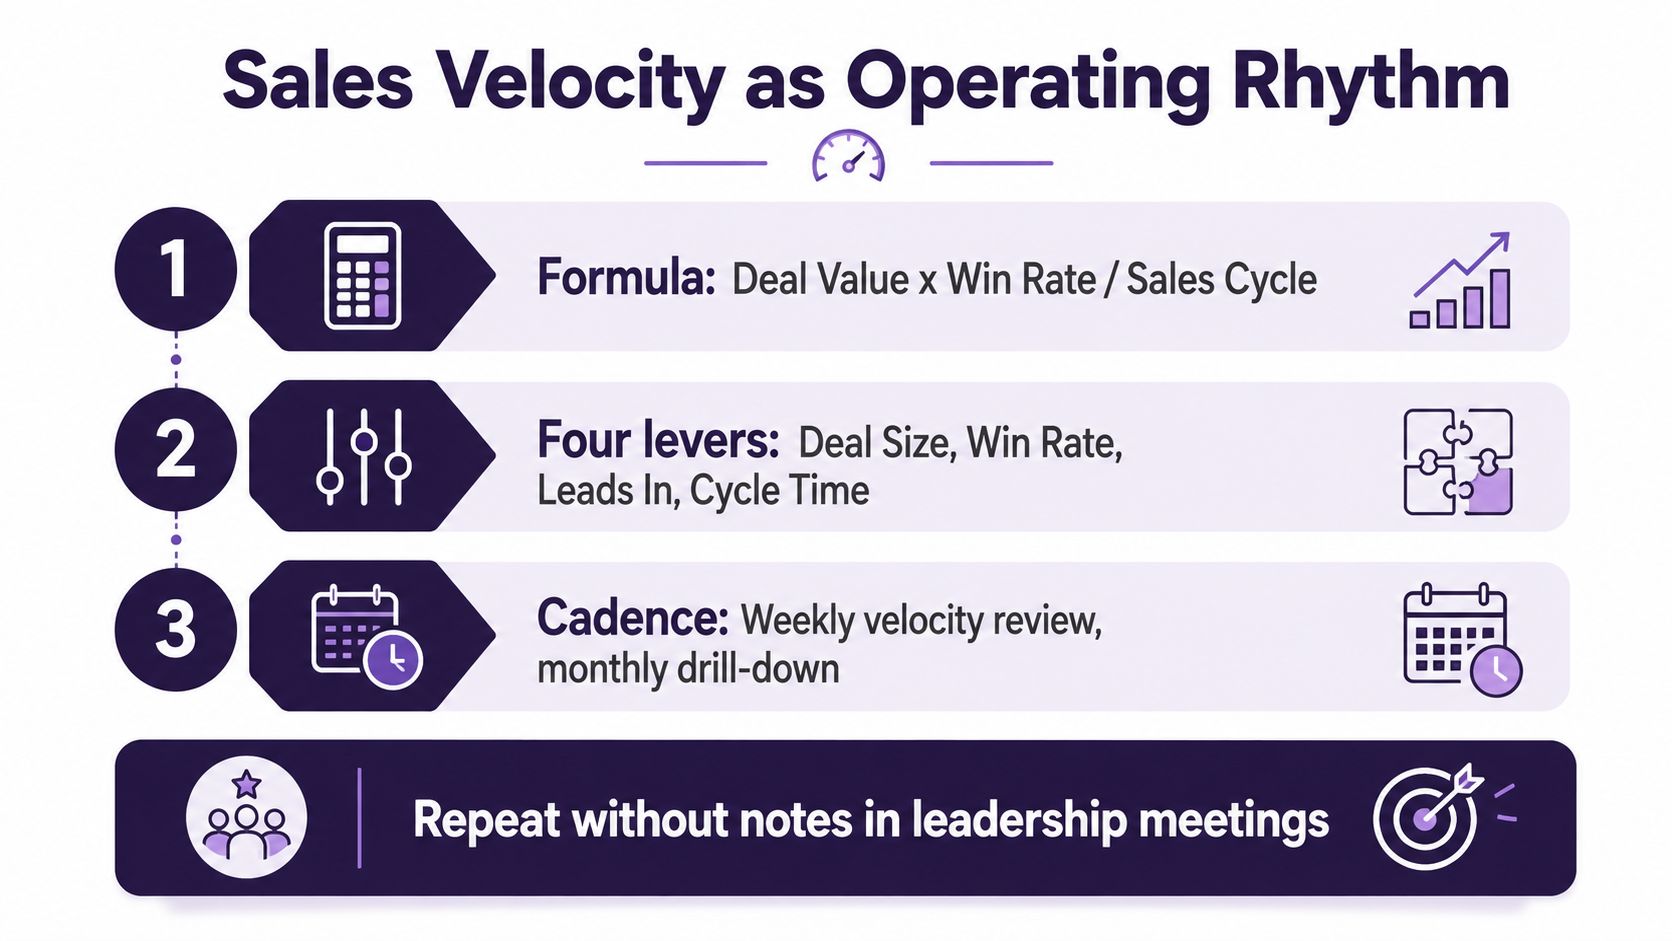
Treat sales velocity as a weekly operating rhythm instead of a spreadsheet exercise. Review input changes with the team, inspect stalled deals, and document which action affected movement. A fractional sales leader can set this cadence, establish accountability, and convert the findings into a focused 90-day plan.
The right starting discussion covers pipeline gaps, forecast discipline, and the velocity target your team needs to reach. Shiny connects startups and growing companies with experienced fractional executives who support sales measurement, forecasting, and pipeline execution. Visit Shiny to explore fractional sales leadership and discuss your next revenue priorities.