How to Create a Sales Forecast Your Business Can Count On
A sales forecast isn't about gazing into a crystal ball. It’s about building an informed, strategic compass for your business. It's a disciplined process of documenting your sales motion, digging into historical data, picking the right forecasting method, and using it to predict future revenue. The goal is to build on a solid data foundation and continuously refine your predictions over time.
But let's be honest. For many founders, forecasting feels like a painful chore, and the final number often feels like a shot in the dark. This guide will change that.
Why a Sales Forecast Is Your Most Crucial Business Tool

Let's cut through the noise. A reliable sales forecast is one of the most important tools you have for navigating your business's future. It’s the difference between blindly reacting to the market and confidently steering your own ship.
Flying blind is a recipe for disaster. Without a clear picture of future revenue, you risk cash flow shortages, bloated inventory, and missing huge growth opportunities. This guide is a practical playbook for building a forecast that helps you make critical decisions across finance, marketing, and operations. We'll cover the essential data, the methods that work, and the common pitfalls that cause so many forecasts to fail.
Think of this as your guide to turning forecasting from an overwhelming task into a genuine strategic advantage.
The Real-World Impact of an Accurate Forecast
A solid sales forecast is the bedrock of sustainable growth. It paints a clear picture of expected revenue, giving your company the confidence to make smart calls on everything from hiring and expansion to major investments.
While a whopping 69% of sales operations leaders say forecasting is only getting harder, a well-executed forecast is directly tied to a company's ability to scale effectively. It's that simple.
This data-driven approach allows you to anticipate market shifts instead of being steamrolled by them. It becomes a roadmap that gets everyone—from sales and marketing to ops and finance—pulling in the same direction. For instance, if your forecast points to a 20% sales lift in a specific region, you can strategically:
- Funnel more marketing spend into that area.
- Bring on more sales reps to handle the incoming demand.
- Make sure your inventory is stocked so you don't run out of product.
It's More Than Just a Number
One of the biggest misconceptions is that a forecast is just a target you set and hope to hit. In reality, it’s a living, breathing part of your financial management and risk reduction strategy. It plugs directly into your bigger picture, like the goals you'd map out in your strategic growth planning.
By giving a clear view of incoming revenue, forecasts empower your finance team to build more accurate budgets and make smarter spending decisions. This foresight is what helps you maintain financial stability and avoid those gut-wrenching cash flow crunches.
For so many growing companies, the whole process of building and maintaining a forecast feels overwhelming. This is often where bringing in a fractional sales leader becomes a game-changer. They have the experience to implement rigorous forecasting processes, ensuring the data is solid and the insights are actually actionable.
Gathering Your Essential Forecasting Data
An accurate sales forecast is built on a foundation of solid data, not guesswork. Before you can even think about predicting the future, you have to get a firm grip on the present.
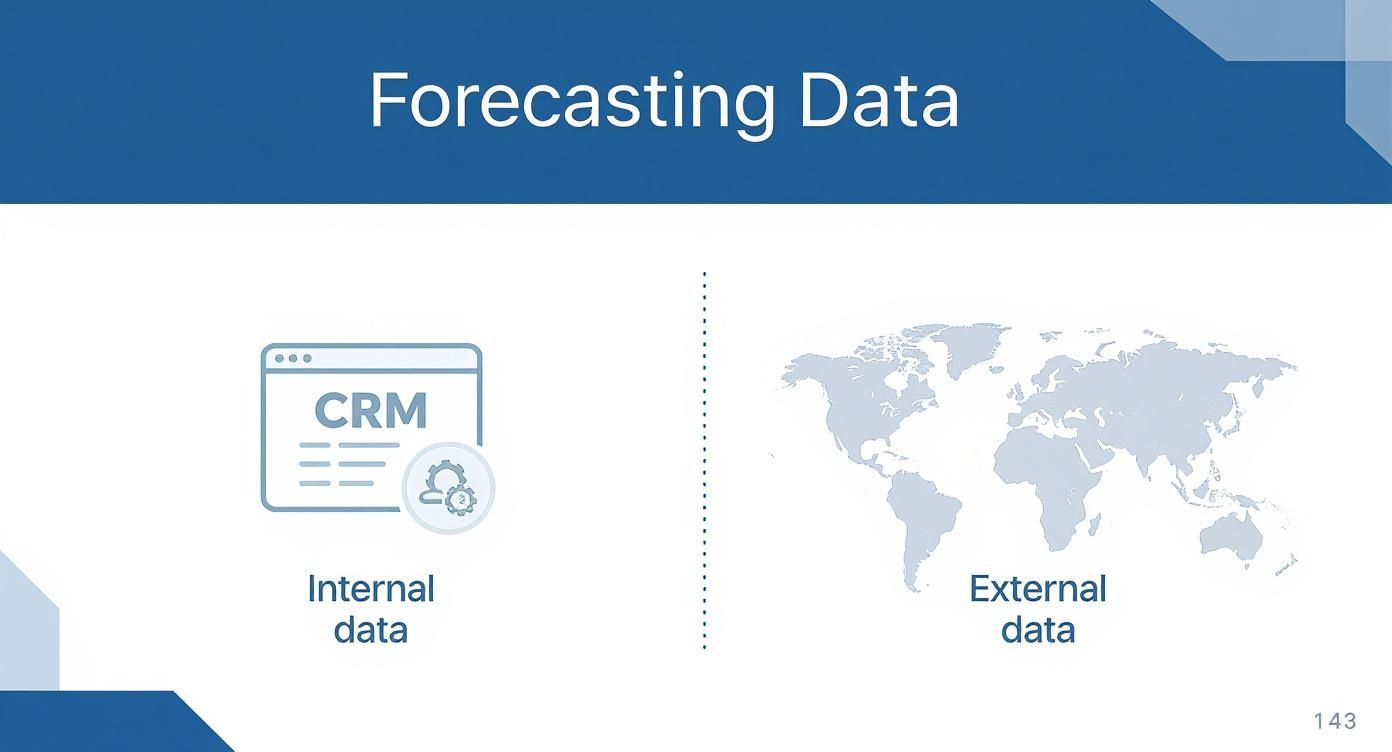
Think of it like a chef prepping for a complex dish. If you just eyeball the ingredients without measuring, the final product is going to be a disaster. The first real step in creating a sales forecast is a data audit—collecting the key internal and external numbers that will become the building blocks for your predictions. Rushing this part is a recipe for a wildly inaccurate forecast that's ultimately useless for any real strategic planning.
Looking Inward: Your Internal Data Sources
Your most valuable forecasting data is already inside your company. The trick is knowing where to find it and how to make sense of it all. For most businesses, the main treasure chest is your Customer Relationship Management (CRM) system.
Something like Salesforce organizes all your key sales metrics in one place, giving you a live look at what’s going on.
This kind of dashboard gives you an immediate snapshot of where your team stands against their quotas and the overall health of your pipeline.
But a dashboard is just the start. You need to dig deeper into your CRM and sales records to pull out the critical metrics. Start by putting together a clear checklist of what you need:
- Historical Sales Figures: Pull your revenue from the last 12-24 months. Break it down by product, region, and even by sales rep to start spotting trends.
- Average Sales Cycle Length: How long does it actually take to close a deal, from the first touchpoint to a signed contract? Knowing this helps you predict when opportunities in your current pipeline might turn into cash.
- Pipeline Data: What’s the total value of all the deals you’re currently working? And how are they spread across the different stages of your sales process?
- Stage-by-Stage Conversion Rates: What percentage of leads actually move from one stage to the next? For example, out of all the demos you give, how many result in you sending a proposal?
- Average Deal Size or Order Value: Understanding your typical transaction size is absolutely crucial for projecting future revenue based on the number of deals you expect to close.
These internal numbers form the quantitative backbone of your forecast. Honestly, just getting this data cleaned up and organized is a huge hurdle for a lot of growing businesses. It's a common pain point where bringing in an experienced fractional sales leader can add immediate value by just establishing some disciplined data hygiene.
Looking Outward: External Market Factors
Your business doesn’t operate in a vacuum. What's happening out in the world can throw a major wrench in your sales performance, and a solid forecast has to account for that. Ignoring external factors is like planning a sailing trip without even glancing at the weather forecast.
This is where you have to zoom out from your own spreadsheets and analyze the bigger picture. Macroeconomic trends are a critical overlay to your internal data. For instance, in a recent year, the National Retail Federation (NRF) projected that total U.S. retail sales would grow between 2.5% and 3.5%, hitting up to $5.28 trillion. A key segment, online sales, was expected to jump between 7% and 9%. Having these benchmarks helps you put your own growth targets into perspective. You can read the full NRF forecast to see how these market-wide predictions can ground your own model in reality.
A classic startup mistake is building a forecast based entirely on their own historical performance while completely ignoring market shifts. A new competitor, a change in regulations, or an economic downturn can make an internally-focused forecast obsolete overnight.
To build a complete picture, make sure you're gathering intelligence in these areas:
- Market Trends: Are new technologies or customer behaviors shaking up your industry? Is the market as a whole growing, shrinking, or just staying flat?
- Competitor Activity: Are your main rivals launching new products, running aggressive price promotions, or moving into your territories?
- Seasonality: Does your business have predictable peaks and valleys throughout the year? A ski resort’s forecast is going to look a whole lot different from an ice cream shop’s.
- Economic Conditions: Things like inflation, unemployment rates, and consumer confidence directly impact your customers' ability and willingness to spend money.
Choosing the Right Forecasting Method
So, you need a sales forecast. Where do you even begin? There’s no single, perfect formula that works for every business. The right method really hinges on your business model, how mature your market is, and—most importantly—the quality of the data you actually have.
Picking the wrong approach is like using a city map to navigate a mountain range. You'll definitely be moving, but probably not in the right direction. To build a forecast you can actually trust, you need to get familiar with the core models. Some are built from the ground up, deal by deal, while others take a bird's-eye view of the entire market. Each gives you a unique lens to see your future revenue.
At a high level, all these methods are fueled by two kinds of data: what’s happening inside your business and the external forces shaping your market.
A solid forecast balances both. You can't just look at your own pipeline and ignore a massive shift in the economy, and you can't just look at market trends without understanding what your sales team can realistically close.
Let's break down the four main ways to tackle this.
Bottom-Up Forecasting: The Deal-by-Deal Approach
A bottom-up forecast is built by adding up all the individual deals in your sales pipeline. It’s a granular, highly specific method that lives and dies by the data your sales team puts into the CRM every day.
Think of it like building a house brick by brick. Each "brick" is a potential deal, complete with an estimated value and a probability of closing. Sum up the weighted value of every opportunity, and you get a comprehensive picture of your expected revenue.
This approach is incredibly powerful for B2B companies with well-defined sales cycles and a high-quality CRM. It gives you a realistic, grounded view because it’s based on tangible activity happening right now.
Top-Down Forecasting: The Market View
In contrast, a top-down forecast starts with the total size of your market and then estimates the percentage you can realistically capture. This is the go-to method for startups entering a new market or launching a product so innovative there's simply no historical data to draw from.
Imagine you're opening a specialty coffee shop. A top-down approach would start with the total number of coffee drinkers in your city (Total Addressable Market), narrow it down to those who frequent local cafes (Serviceable Available Market), and finally, estimate the share of those customers you can actually win (Serviceable Obtainable Market).
This method is less about individual deals and more about validating your market potential. It’s a crucial exercise for stress-testing a business idea and setting ambitious, long-term growth targets. This kind of high-level projection is also a fundamental part of building a startup financial model that will get investors excited.
The biggest risk with top-down forecasting is falling in love with a huge market size and assuming you'll easily capture a piece of it. Without a clear strategy for how you'll win that market share, the numbers are just wishful thinking. A seasoned fractional executive can provide a crucial reality check on these assumptions.
Historical Forecasting: Looking Backward to Look Forward
The historical forecasting method is exactly what it sounds like: it uses your past sales data to predict future performance. It’s the simplest approach and can work surprisingly well for stable businesses with consistent sales patterns and several years of data to pull from.
For example, a company might see a consistent 15% year-over-year growth for the past three years. A simple historical forecast would just project that same 15% growth for the next year. You can get a bit more sophisticated by layering in seasonality—like a retailer knowing that Q4 sales are always 40% higher than Q3.
Of course, this method is only reliable when the past is a good predictor of the future. In a rapidly changing market, that's a big "if."
Pipeline-Based Forecasting: A Real-Time Health Check
A pipeline-based forecast is a more dynamic and sophisticated version of the bottom-up method. It analyzes your current sales pipeline but applies a weighted probability to each deal based on its specific stage in your sales process.
For instance, you might assign probabilities based on historical conversion rates:
- Discovery Call: 10% chance of closing
- Demo Completed: 30% chance of closing
- Proposal Sent: 60% chance of closing
- Contract Negotiation: 80% chance of closing
You then multiply the value of each deal by its stage probability to get a weighted forecast. This provides a fluid, real-time snapshot of your pipeline's health and is a standard feature in most modern CRMs like HubSpot or Salesforce.
Comparing Sales Forecasting Methods
Each forecasting method offers a different perspective on your future revenue. To help you decide which is right for your startup, here’s a quick comparison of their strengths, weaknesses, and ideal use cases.
| Method | Best For | Data Required | Pros | Cons |
|---|---|---|---|---|
| Bottom-Up | Short-term forecasting (monthly, quarterly) for businesses with established sales pipelines. | Detailed CRM data on individual deals, including value and stage. | Highly accurate and grounded in real sales activity. Promotes sales team accountability. | Time-consuming to maintain. Heavily reliant on diligent CRM usage by the sales team. |
| Top-Down | New businesses, new markets, or new product launches with no historical sales data. | Market size data (TAM, SAM, SOM) and realistic market share assumptions. | Excellent for strategic planning and validating a business model. Forces a hard look at the market. | Can be overly optimistic. Less useful for short-term operational planning. |
| Historical | Stable, mature businesses with predictable sales cycles and several years of consistent data. | Past sales performance data, ideally broken down by period (month, quarter). | Simple to calculate and provides a solid baseline. | Completely ignores current market shifts, competitor actions, or internal changes. Backward-looking. |
| Pipeline-Based | Companies with a well-defined sales process looking for a dynamic, real-time forecast. | CRM data plus historical conversion rates for each sales stage. | Provides a real-time, weighted view of expected revenue. Helps identify bottlenecks in the sales process. | Accuracy depends entirely on having accurate, consistently applied stage probabilities. |
Ultimately, the most robust sales forecasts often blend elements from multiple methods. You might use a top-down model to set your annual goal, a pipeline-based forecast to manage your quarter, and historical data to check for seasonal trends. The key is to understand the limitations of each and choose the right tool for the job.
Building Your Forecast and Planning for Scenarios
Alright, you've gathered your data and picked a forecasting method. Now for the fun part: rolling up your sleeves and actually building the model. Whether you're working in a Google Sheet or your CRM's native tools doesn't really matter. The mechanics are simple—it's the strategic thinking behind the numbers that counts.
Here’s where most people go wrong: they build one forecast and treat it as gospel. That’s not a strategy; it’s a prayer. A single number is a target, but a range of scenarios is a plan. To really understand your company’s resilience—and its breaking points—you need to bake in scenario planning from day one.
Structuring Your Forecasting Model
A good model is built on transparency. You need to be able to see exactly which assumptions are driving your numbers so you can tweak them later. The best place to start is with your "most likely" forecast, using the historical data you've already pulled.
This baseline model should be a straightforward calculation based on your core metrics: average deal size, sales cycle length, and stage-by-stage win rates. For a B2B SaaS company, this might look like multiplying the number of new demos booked each month by the historical demo-to-close rate, then multiplying that by your average annual contract value. Simple.
Once this realistic model is locked in, it becomes the foundation for everything else. This structured approach keeps the process manageable and saves you from a world of headaches down the road.
A forecast built on hidden or poorly defined assumptions is a house of cards. When the numbers look off, you won't know which lever to pull. Clearly document every key driver, from lead volume to close rates, so you can pressure-test your model effectively.
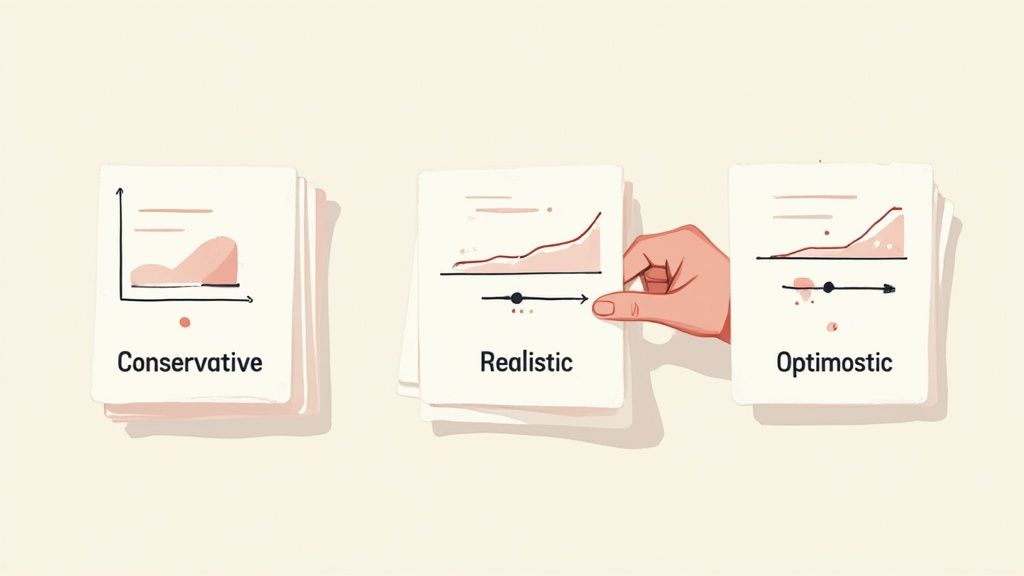
Developing Best-Case and Worst-Case Scenarios
With your realistic forecast set, it’s time to explore the extremes. This is where you map out your optimistic (best-case) and conservative (worst-case) scenarios. The goal isn't to pull numbers out of thin air, but to systematically adjust the key variables in your model based on plausible events.
For each scenario, ask yourself: what would have to be true for this to happen? This simple question transforms forecasting from a passive exercise into an active, strategic tool.
- Optimistic (Best-Case) Scenario: What if that new marketing campaign absolutely crushes it? Or a major competitor fumbles? To model this, you might bump your lead-to-opportunity conversion rate by 10-15% or shave a week off your average sales cycle. This scenario doesn’t just feel good—it tells you what resources you’d need (like hiring more reps) to capitalize on a sudden win.
- Conservative (Worst-Case) Scenario: On the flip side, what if your top salesperson quits? Or an economic downturn tightens customer budgets? For this model, you could slash your average deal size by 20% or add two weeks to the sales cycle. This forecast is your early warning system. It reveals your business’s breaking points and helps you build a contingency plan to protect cash flow.
The Power of Scenario-Based Planning
Thinking in scenarios fundamentally changes how you run your business. Instead of reacting to a downturn, you have a plan ready. Rather than getting swamped by a sudden spike in demand, you’ve already thought through how to scale.
A tech startup could use this approach to map out its hiring plan for the year.
- Realistic Plan: Hire two new sales reps in Q3.
- Optimistic Plan: If Q2 revenue beats the forecast by 25%, we fast-track those hires to Q2 and add a sales development role.
- Conservative Plan: If Q1 revenue misses the forecast by 15%, we freeze one sales hire and shift that budget to lead generation.
This is the kind of discipline that separates high-growth companies from the ones that get caught flat-footed. Let's be honest, though—building this strategic muscle is tough for founders who are already stretched thin. This is why so many growing businesses turn to a fractional sales leader. These are experienced execs who have built hundreds of forecasting models. They can implement a robust scenario planning process in a fraction of the time, giving you the strategic foresight to navigate whatever the market throws at you.
By moving beyond a single, static forecast, you’re creating a dynamic decision-making framework. You're no longer just predicting the future; you're preparing to meet it.
This strategic depth is what transforms a simple sales forecast into one of your most valuable business assets. If you're ready to build a forecasting process that drives real growth, our network of vetted fractional executives is here to help. Explore our services to find the right leadership to guide your strategy.
Avoiding Common Pitfalls and Tracking Accuracy

A sales forecast is only as good as the data and discipline behind it. You can build the most elegant model in the world, but it becomes useless pretty fast if you fall into the same traps that trip up most growing companies.
The real goal here isn't to create a static spreadsheet you look at once a quarter. It's to build a living, breathing tool that gets smarter and more reliable over time. That takes discipline, a sharp eye on the right metrics, and a commitment to actually learning from your results.
Sidestepping Common Forecasting Traps
I've seen even the most promising forecasts get derailed by a few classic mistakes. Spotting these early is half the battle in building a model you can actually bank on.
The number one offender? Unchecked optimism. Your sales reps are wired to be positive—that's their job. But when that bleeds into the forecast without a reality check, you end up with inflated numbers you have no hope of hitting.
Right behind that is a reliance on messy CRM data. If your team isn't religious about updating deal stages, values, and close dates, your forecast is built on a foundation of sand. It’s the classic "garbage in, garbage out" scenario, and it's probably the single biggest reason forecasts fail.
Finally, so many companies completely fail to account for seasonality. They either panic during a predictable summer slump or over-hire after a Q4 spike, never realizing these are just annual rhythms of their business. Ignoring these cycles leads to terrible assumptions and even worse resource planning.
A forecast is a tool for strategic navigation, not a wish list. The moment it becomes detached from the reality of your data and market conditions, it loses all value. The key is to balance ambition with objective analysis.
Establishing a Framework for Accuracy
To get beyond pure guesswork, you need to track specific KPIs that tell you how healthy and accurate your forecasting process really is. These metrics are the feedback loop you need to keep refining your approach.
Here are the two most important metrics you should be watching:
- Forecast Accuracy Percentage: This one is straightforward. You just compare your projected sales to your actual sales for a given period. If your accuracy rate is consistently dipping below 85-90%, it's a huge red flag that something is broken in your data, your method, or your assumptions.
- Pipeline Coverage Ratio: This ratio stacks up the value of your open pipeline against your sales quota. A good rule of thumb is to aim for a 3x coverage ratio. That means for every dollar in your quota, you have three dollars in your active pipeline. If that ratio starts to drop, it’s an early warning that you're going to miss future targets.
Making a habit of reviewing these numbers is non-negotiable. You can get some great ideas for visualizing these metrics by checking out these examples of effective executive dashboards that turn raw numbers into clear, actionable insights.
Overlooking External Market Dynamics
It's also shockingly easy to get so focused on your own pipeline that you forget to look outside. Your forecast needs to be grounded in the reality of the broader market.
Take ecommerce, for example. Global sales are on track to hit $6.42 trillion and are expected to climb to $7.89 trillion within three years. This sector just made up 21.1% of all retail sales, and that share is only growing. If you're in that space, ignoring a trend that massive would make your forecast fundamentally flawed.
Keeping up this level of discipline is a heavy lift, especially for lean teams. This is exactly why so many scaling companies bring in an experienced fractional sales leader. They’ve been through this before. They know how to instill rigorous processes, hold the team accountable for data hygiene, and ultimately turn your forecast from a liability into a reliable strategic compass.
Your Top Forecasting Questions, Answered
When you're building a sales forecast for the first time, it's natural to have questions. The whole process can feel a bit overwhelming, but the most common hurdles have pretty straightforward solutions. Let's tackle the questions we hear most often from founders and sales leaders.
Getting clear answers will help you build momentum and move forward with confidence, so you can stop sweating the small stuff and focus on the big picture.
How Often Should I Update My Sales Forecast?
For fast-moving businesses—think startups or e-commerce brands—a monthly review is non-negotiable. You need to check your forecast against your actual results that often to adapt quickly. If you're in B2B with longer sales cycles, a formal update every quarter might be enough.
The real key here is consistency. Your forecast should be a living, breathing document, not some static report you create once and then promptly forget about.
Think of your forecast as a GPS. You wouldn't just check it once at the start of a long road trip. You’d glance at it periodically to make sure you're still on the right path, adjusting for any unexpected traffic or detours. A regular review cadence does the exact same thing for your business.
What Is the Best Tool for Creating a Sales Forecast?
Honestly, in the very early days, a well-structured spreadsheet is perfect. It’s flexible, it costs nothing, and it forces you to get your hands dirty with the numbers. This is a huge benefit—it really deepens your understanding of what drives your business.
Once your business starts to scale, the next logical step is to move your forecast into your CRM (like Salesforce or HubSpot). This shift unlocks some serious advantages:
- It’s automated. The forecast pulls in real-time data directly from your sales pipeline.
- Fewer errors. You slash the risk of mistakes that come from manual data entry.
- Live insights. You get an up-to-the-minute view of your sales health, anytime you want it.
How Can I Forecast with No Historical Data?
This is the classic startup dilemma, but it's totally solvable. When you can't look backward, you have to build your forecast from the ground up, focusing on activity and capacity.
Start with what your team can realistically achieve. Ask questions like:
- "How many outreach calls can one sales rep actually make in a week?"
- "What's a conservative conversion rate for our industry at each stage of the funnel?"
Combine this bottom-up, activity-based model with a top-down look at your total addressable market (TAM). This blend of what's possible (your team's capacity) and what's available (the market size) gives you a defensible starting point. Just be ready to revise it often as real performance data starts trickling in.
Navigating these forecasting challenges takes a mix of the right process and seasoned experience. For a lot of growing businesses, the smartest move is to bring in that leadership without the full-time price tag. Shiny connects you with a network of over 3,000 vetted fractional executives who can build a robust forecasting framework and guide your strategic growth. Find the right executive to build your financial roadmap today.