
How to Analyze Financial Statements Like an Expert
To truly understand the health of your business, you need to get comfortable with your financial statements. The process isn't just about glancing at numbers; it's about methodically reviewing your income statement, balance sheet, and statement of cash flows to uncover the story they tell. By calculating key ratios and spotting trends, you move past gut feelings and start making strategic, informed decisions that actually drive growth.
This isn't about becoming an accountant. It's about becoming a smarter leader.
Why Financial Analysis Is Your Secret Weapon for Growth
As a founder, you're making dozens of decisions a day. Can we afford that new marketing campaign? Is this product line truly profitable? Should we expand now or wait? Too often, these critical questions are answered with intuition instead of hard data.
This is where learning to analyze your financials stops being a chore and becomes your most powerful strategic tool.
Think of your financial statements as a car's dashboard. The speedometer (revenue), fuel gauge (cash flow), and engine temperature (profitability) all provide critical, real-time feedback. Ignoring them is like driving blindfolded. Once you learn to read these gauges, you can proactively manage cash, boost profitability, and spot opportunities before your competitors do. It’s the difference between guessing and knowing.
Moving from Intuition to Insight
For so many founders, the shift from gut-feel decisions to data-backed strategy is an absolute game-changer. It flips the entire operation from reactive to proactive, providing the clarity needed to navigate complex challenges.
This is the journey right here: from a simple hunch to leveraging real data for sustainable growth.
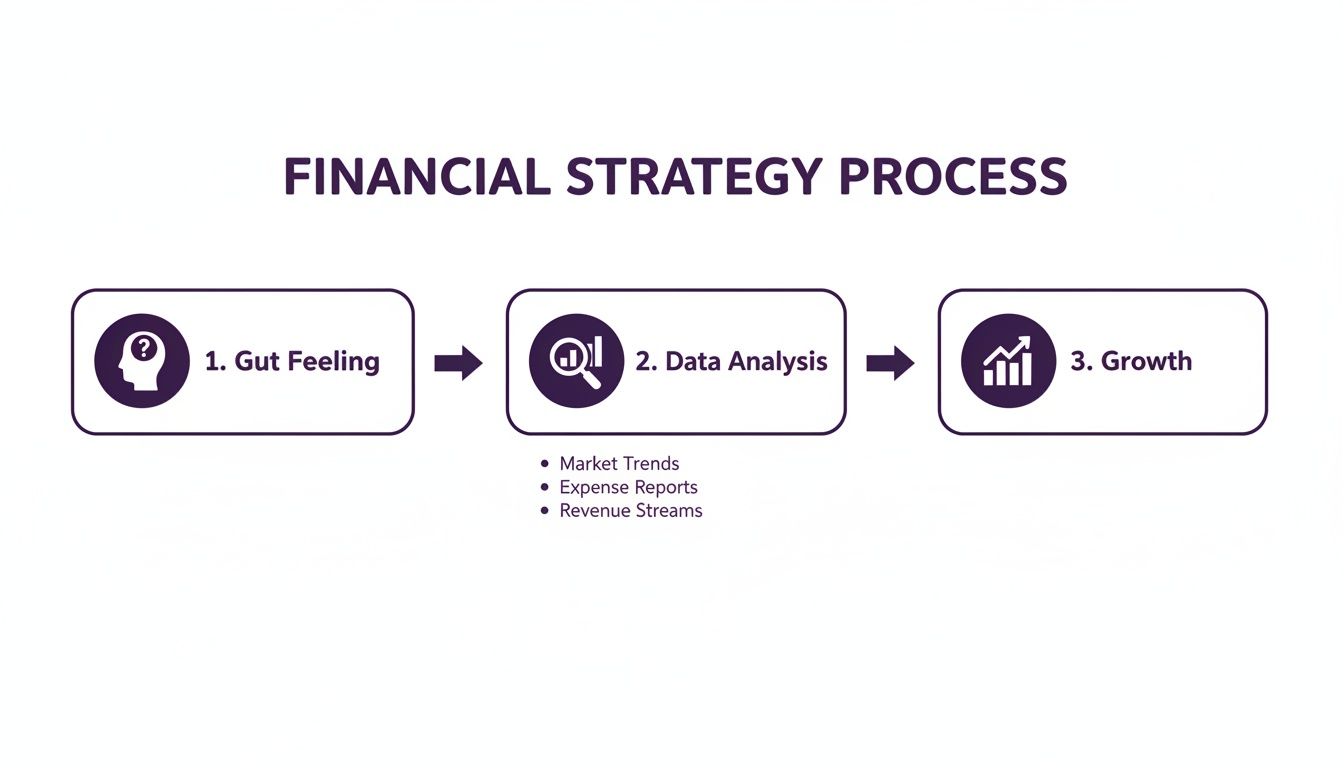
This path shows how raw numbers, when properly analyzed, translate directly into tangible business expansion and confident leadership.
The Value of Financial Clarity
Understanding your financials is the bedrock of scaling intelligently. When you have a clear financial picture, you can confidently make calls on:
- Resource Allocation: Know exactly where to invest capital—whether it's marketing, R&D, or new talent—to get the highest return.
- Performance Measurement: Set realistic goals and track progress against concrete financial metrics, not just vanity metrics that feel good but mean little.
- Risk Management: Spot potential cash flow shortages or declining margins early enough to take corrective action, avoiding preventable crises.
Financial literacy isn't about becoming an accountant; it's about becoming a more effective leader. When you can confidently read the story your numbers are telling, you gain control over your company's destiny.
This knowledge becomes a powerful asset when you need specialized help. If you have a firm grasp of your company's financial position, a fractional CFO can plug in and deliver strategic value from day one. Instead of spending weeks just making sense of the numbers, they can dive right into turning your financial insights into an actionable growth plan.
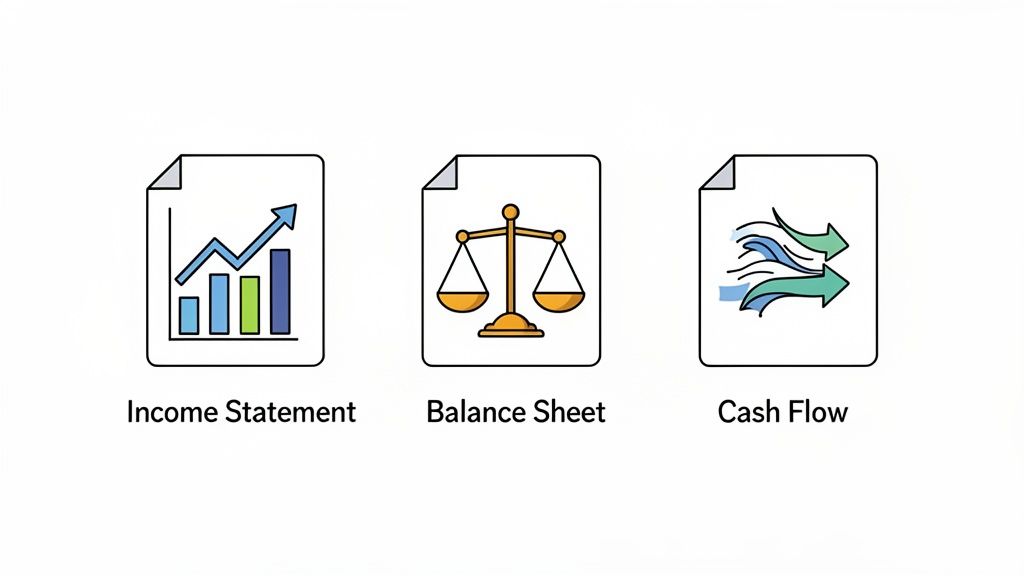
Decoding the Three Core Financial Statements
To get a handle on your business's health, you need to understand the unique story each of your financial statements tells. Think of them as three different camera angles on your company. Each provides a distinct perspective, and only by looking at all three do you see the complete picture.
Let's break down the "Big Three" without the confusing jargon. This is about building the confidence to look at these reports and immediately know what they mean for your business.
The Income Statement: Your Profitability Story
The Income Statement, often called the Profit and Loss (P&L), is like a movie showing your financial performance over a specific period—a month, a quarter, or a year.
It starts with your total revenue and then subtracts all the costs and expenses incurred to earn that revenue. The final line, net income, tells you whether you actually made money during that time.
For example, imagine a growing e-commerce brand that generated $500,000 in revenue last quarter. The P&L lists that at the top, then subtracts the Cost of Goods Sold (COGS) to find the Gross Profit. From there, it deducts operating expenses like marketing, salaries, and rent. The result is your net income—the ultimate "bottom line."
The Balance Sheet: A Snapshot in Time
While the P&L is a movie, the Balance Sheet is a single photograph. It freezes a specific moment to show your company's financial position, detailing what you own (Assets), what you owe (Liabilities), and what's left for the owners (Equity).
The magic of the balance sheet is that it always has to balance based on one non-negotiable rule:
Assets = Liabilities + Equity
This simple formula gives you an instant check on your company's financial structure. For our e-commerce brand, assets would include cash, inventory, and accounts receivable. Liabilities would include supplier bills and loan payments. A company can look profitable on its P&L but still be in trouble if its liabilities are piling up faster than its assets.
The Statement of Cash Flows: Following the Money
For a founder, the Statement of Cash Flows is arguably the most critical document. It tracks how actual cash moves in and out of your business. Profit is an accounting concept, but cash is what you use to make payroll and keep the lights on. It’s not uncommon for a "profitable" company to fail because it ran out of cash.
This statement breaks cash movement into three activities:
- Operating: Cash from your main business operations.
- Investing: Cash used to buy or sell long-term assets, like equipment.
- Financing: Cash from investors or banks, or used to repay debt.
A positive cash flow from operations is a fantastic sign; it means the core business is generating real money. This statement connects the P&L and Balance Sheet, showing how reported profits translate (or don't) into cold, hard cash. This foundation is exactly what you need for effective startup financial modeling, which is all about forecasting where your business is headed.
Unlocking Trends with Horizontal and Vertical Analysis
Once you're comfortable with the core statements, the real analysis begins. The true story emerges when you start comparing numbers over time. This is how you spot trends, uncover red flags, and understand the narrative your business is telling you.
Two of the most powerful techniques are horizontal analysis and vertical analysis. They sound complex, but they're intuitive ways to give raw numbers much-needed context.
Think of it like this: a single statement is a photograph. It's useful but static. Horizontal and vertical analysis turn that photo into a time-lapse video and a detailed blueprint, revealing the full picture of what's changing.
Horizontal Analysis: Looking Across Time
Horizontal analysis, or trend analysis, is your time-lapse video. It involves looking at your financial data "horizontally" across multiple periods—month-over-month, quarter-over-quarter, or year-over-year. This is how you measure your business's momentum.
It answers the crucial question: "How are we doing compared to before?"
The math is simple; you’re just calculating the percentage change.
Formula: ((Current Period Amount – Prior Period Amount) / Prior Period Amount) * 100
This calculation is a founder's best friend for spotting patterns of growth or decline. For instance, a sharp jump in accounts receivable could be a red flag for collection problems. As you can read more about spotting financial trends, this is how leaders evaluate performance with real precision.
Vertical Analysis: Looking From Top to Bottom
If horizontal analysis is the time-lapse, vertical analysis is the high-resolution blueprint of a single moment. You look at one statement for one period and express every line item as a percentage of a key figure—usually total revenue on the Income Statement or total assets on the Balance Sheet.
Here’s why it’s so valuable:
- It exposes your cost structure. Instantly see that your Cost of Goods Sold (COGS) eats up 40% of every dollar of revenue.
- It highlights proportional shifts. Did revenue grow but your gross margin percentage shrink? This shows your costs are rising faster than sales.
- It unlocks benchmarking. Easily compare your cost structure to industry averages, regardless of company size.
Putting It All Together: A SaaS Startup Example
Let's see how a fractional executive would use these tools to analyze a growing SaaS startup over two years.
Horizontal Analysis in Action
The executive lines up two years of Income Statements.
- Revenue Growth: Revenue jumped from $2M to $3M—a healthy 50% increase.
- Expense Trends: However, R&D expenses shot up from $400k to $800k (a 100% increase), and Sales & Marketing costs also doubled from $600k to $1.2M.
The insight is crucial. While revenue is growing nicely, key expenses are growing twice as fast. This trend is unsustainable and is gutting profitability.
Vertical Analysis for Deeper Context
Next, the executive runs a vertical analysis on this year's Income Statement.
- R&D Costs: R&D is now 27% of revenue (up from 20% last year).
- S&M Costs: Sales & Marketing is a staggering 40% of revenue (up from 30%).
This confirms what the horizontal analysis hinted at: the company’s cost structure is getting heavier. The proportion of revenue being plowed back into acquisition and development is ballooning. By combining these methods, the executive has pinpointed a core scaling problem: the company's growth engine is becoming inefficient. This is where a seasoned financial leader proves their worth—not just reporting numbers, but interpreting them to steer the business toward sustainable growth.
Crunching the Ratios That Actually Matter
Raw numbers and trend lines are a solid start, but to get under the hood of your company's health, you need financial ratios. Ratios are like vital signs for your business, translating raw data into standardized metrics that tell a powerful, actionable story.
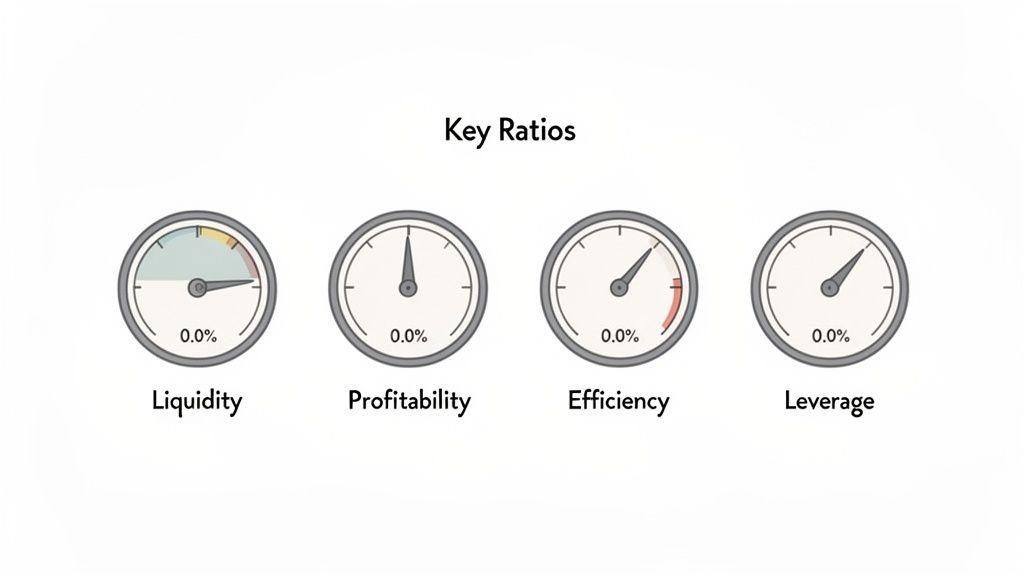
For most founders, a small handful of key ratios will provide 80% of the insights you need. We'll group them into four buckets that answer the most critical questions about your business.
Liquidity Ratios: Can You Pay Your Bills?
Liquidity measures your ability to meet short-term obligations due within the next year. This is a direct measure of your financial stability. Being profitable on paper means nothing if you can't make payroll next month.
- Current Ratio: Current Assets / Current Liabilities
- What it tells you: For every dollar you owe in the short term, how many dollars in short-term assets (like cash) do you have to cover it? A ratio below 1:1 is a massive red flag.
Profitability Ratios: Are You Actually Making Money?
These ratios show how good your business is at turning revenue into profit. They expose the true efficiency of your operation.
- Gross Profit Margin: (Revenue – Cost of Goods Sold) / Revenue
- What it tells you: After paying for what you sell, what percentage of each dollar of revenue is left? A shrinking margin means your costs are getting out of control.
- Net Profit Margin: Net Income / Revenue
- What it tells you: After every single expense is paid, what percentage of revenue is left as pure profit? This is the ultimate bottom line.
Analyzing these over time is key. As you can discover more insights about trend analysis on Saylor.org, this is standard practice for major companies communicating financial patterns.
A business can appear profitable but still face a devastating cash crunch. This is a common pitfall where a healthy Income Statement masks a dangerous cash flow problem. Liquidity ratios are your early warning system.
Efficiency Ratios: How Well Are You Using Your Assets?
These metrics measure how productively you're using your assets to generate sales.
- Inventory Turnover: Cost of Goods Sold / Average Inventory
- What it tells you: How many times did you sell through your entire inventory in a period? A higher number signals strong sales and efficient capital use. A low number suggests you're overstocked. To dig deeper, you can also check out our guide on what unit economics are.
Leverage Ratios: How Much Risk Are You Carrying?
Leverage ratios show how much of your company is funded by debt versus equity. Too much debt creates serious financial risk.
- Debt-to-Equity Ratio: Total Liabilities / Total Shareholder Equity
- What it tells you: This compares money from creditors to money from owners. A high ratio means you're aggressively financed with debt, which can be great in good times but dangerous in a downturn.
Turning Financial Insights Into Actionable Strategy
Analysis without action is just an academic exercise. The goal of digging into your financial statements is to connect the data to your next strategic move. This is how your insights become a competitive advantage, enabling smarter, faster decisions that drive real growth.
It’s all about spotting warning signs before they become crises and seizing opportunities before they’re gone. You're translating numbers on a page into a clear roadmap for your business.
From Red Flags to Green Lights
Your analysis will uncover problems. That's a given. The skill is knowing how to respond. Every red flag is an opportunity to strengthen your business.
Consider a professional services firm whose analysis shows that the Accounts Receivable Turnover ratio is tanking. In simple terms: it's taking longer and longer to get paid by clients.
Instead of waiting, a leader takes proactive steps:
- Tighten Collections: Automate invoice reminders and shorten payment terms from 60 to 30 days.
- Rethink Contracts: Require an upfront deposit for new projects to improve cash flow.
- Vet New Clients: Run credit checks on larger clients to avoid those with a history of late payments.
This is turning a financial pain point into a stronger, more resilient business process.
The Power of Benchmarking
Knowing your own numbers is only half the story. To truly understand your performance, you must see how you measure up to your peers. This is where benchmarking is a game-changer.
Benchmarking is simply comparing your key financial ratios against industry averages. Are your operating expenses 15% of revenue when competitors average 10%? That’s a massive signal to find inefficiencies.
Understanding how you perform relative to your peers is crucial. It provides objective context, revealing whether your "good" numbers are actually great or simply average for your sector.
This outside perspective is critical for setting ambitious yet realistic goals. It helps you answer tough questions like, "Are we investing enough in R&D to stay ahead?" or "Is our debt load too heavy for a company our size in this market?"
When Insights Demand Expert Guidance
As you go deeper, you'll uncover both tactical fixes and complex strategic challenges. Tightening your invoicing process is tactical. Realizing your entire business model is less efficient than your competitors is strategic—and calls for a higher level of expertise.
This is often the perfect time to bring in specialized leadership. When your analysis uncovers huge growth opportunities or deep operational flaws, a fractional CFO can be invaluable. They don't just see the numbers; they have the experience to build the strategy behind them. A fractional executive can translate your data into a winning growth plan, whether that means securing funding or overhauling your pricing model. This is also essential for building out a robust financial model, a topic we cover in our guide on financial forecasting for startups.
Common Questions About Financial Statement Analysis
You've got the techniques. But how does this play out in the real world? Let's tackle some of the most common questions from founders trying to put these ideas into practice.
How often should I be doing this?
For day-to-day operational control, a monthly review is non-negotiable. This is your early warning system to catch creeping costs or a dip in sales before they snowball. For more strategic conversations, like board meetings or investor updates, a quarterly analysis is standard. And of course, a deep dive is done annually for tax planning and big-picture performance review.
For a startup, which statement matters most?
They're all critical, but for an early-stage company, it’s the Statement of Cash Flows. It's painfully common for a startup to look profitable on paper but go under because it ran out of cash.
The cash flow statement is your reality check. It shows your true cash position and runway, answering the ultimate survival question: "How much time do we have left?"
This statement cuts through the accounting noise and tells you if your core business is actually generating cash or just burning it.
Do I need an accounting degree to understand this?
Absolutely not. Your goal as a founder isn't to become a CPA. Your job is to understand the story the numbers are telling. Focus on the trends and key ratios we've walked through. Once you get the hang of interpreting the data, you'll have the insights you need to lead with confidence.
When your analysis points to bigger challenges—or massive growth opportunities—that need a heavier strategic lift, having the right expert in your corner can change the game. We connect businesses with elite, vetted fractional executives who know how to turn financial data into a winning growth plan. If you're ready to move from insight to action, let's talk. Find the seasoned leadership you need to scale confidently.