Pivot Power Excel: How to Build a Data Model That Adds Up
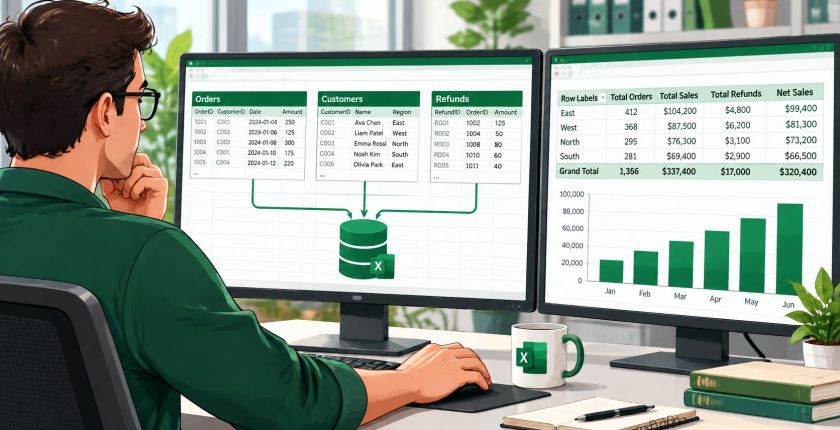
Your sales lead sends over the orders, customers, and refunds exports. The revenue PivotTable looks reasonable until someone asks for net sales by customer region. After another lookup column and a copied worksheet, the grand total no longer matches finance's report.
That's the challenge behind pivot power Excel: not making a summary appear, but making it trustworthy. Power Pivot gives you better tools for connecting data and defining calculations. You still need to decide what each record represents, prove the totals, and make sure the next person can refresh the workbook without changing its meaning.
Why Power Pivot Matters Once Your Data Outgrows a PivotTable
A conventional PivotTable built from an orders table can summarize orders well. It can't automatically explain how separate customer attributes and refund transactions should affect that summary. Flattening everything into one export may work temporarily, but it also creates opportunities to duplicate sales when an order has multiple refunds.
Power Pivot lets you load related tables into a single Data Model, connect them through relationships, and define measures that calculate across those tables. You preserve the separate records instead of copying customer details and refund amounts onto every order line.
Recognize the point where lookups stop helping
Look for these warning signs:
- Stacked VLOOKUP chains: A calculation depends on several intermediate matches that nobody checks.
- Copied lookup columns: Different worksheets contain different versions of the same customer classification.
- Unstable totals: Adding a sheet or extending an export changes which records a report includes.
The productivity case is meaningful, but it isn't a promise of automatic savings. According to the 2024 FP&A Trends Survey, as reported by DataRails, 35% of FP&A professionals' time was spent on high-value work such as generating insights. Better analysis tools can help reclaim time from repetitive preparation, provided the model doesn't introduce another reconciliation burden.
For a growing business, this is a practical starting point for business intelligence for startups: answer a consequential question with controlled definitions before building a larger reporting stack.
Write down the tables you'd load first and the business question each supports. Orders might establish billed sales, customers might supply region, and refunds might establish deductions. Don't import a table unless you can explain its purpose.
Load Your Data into the Power Pivot Data Model
Start in a Windows desktop edition of Excel that includes Power Pivot. If the add-in isn't available, resolve that before preparing a workbook that another employee is expected to maintain.
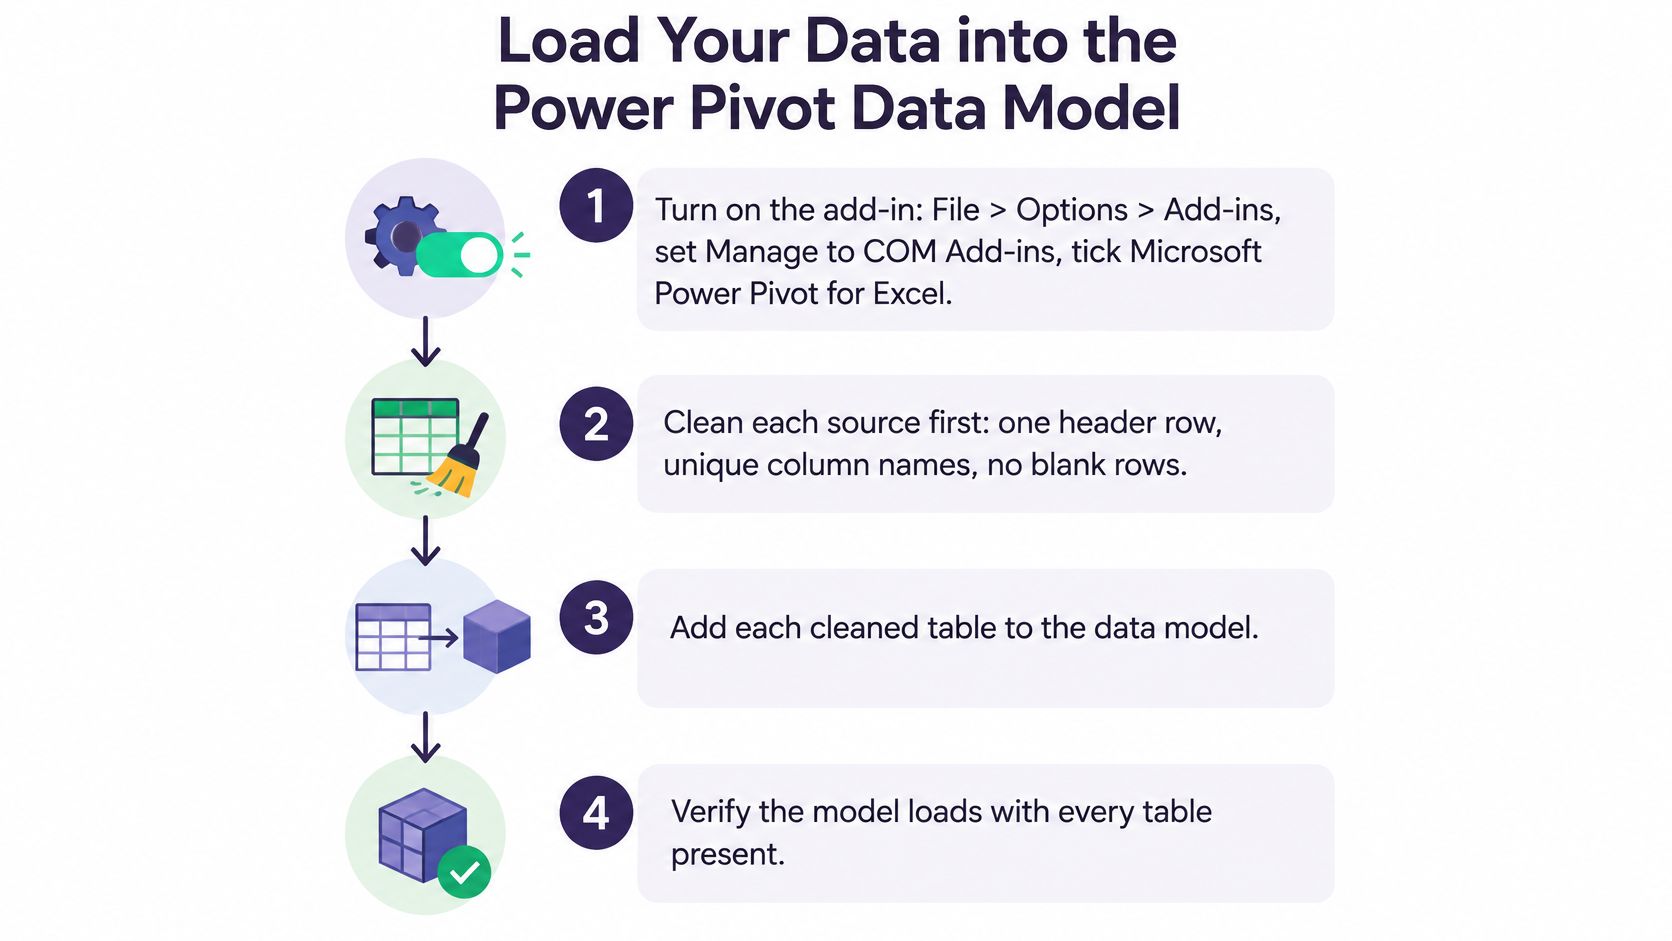
Use this loading workflow to keep source preparation separate from model design.
Prepare and load each source
Enable the add-in. Go to File > Options > Add-ins, set Manage to COM Add-ins, and select Microsoft Power Pivot for Excel. If it isn't listed, check the installed edition and your organization's software configuration rather than repeatedly reinstalling the workbook.
Remove presentation formatting. Give each source one header row, unique column names, and no merged cells or title blocks above the headers. Say a sales export begins with a three-row title block: importing it as though the first row were the header can create phantom blank records and an incorrect first column name.
Choose the appropriate import route. For files and databases, use Data > Get Data, prepare the query, then choose Close & Load To, select a connection-only load when appropriate, and tick Add this data to the Data Model. For an existing worksheet range, convert it to an Excel table and select Power Pivot > Add to Data Model.
Verify the imported records. Open Power Pivot > Manage and compare each table's loaded row count with the source's data-record count, excluding headings and footer totals. Investigate discrepancies before continuing, especially promoted headers, removed errors, and filters applied in Power Query.
Make the field list usable. Rename columns with plain business names and hide technical keys or helper fields from client tools when report users don't need them. Hiding a key doesn't remove it from the model or prevent a relationship from using it.
Set explicit data types. Check dates, amounts, and identifiers in Power Query before loading. A date stored as text won't behave like a date, while converting an identifier to a number can remove meaningful leading zeros.
Import sources and how to load them
| Source | How to load it | Watch for |
|---|---|---|
| Excel table or range | Convert to a table, then Add to Data Model from the Power Pivot tab | Blank header rows and merged cells |
| CSV or text file | Data, Get Data, From Text/CSV, then load to the Data Model | Date formats and delimiters that differ by region |
| SQL Server or other database | Data, Get Data, From Database, then load to the Data Model | Credentials and permission to refresh |
| Existing PivotTable cache | Not a source: rebuild from the underlying table | Stale caches that hide recent rows |
For recurring exports, put cleanup steps in Power Query, not in a checklist telling an employee to delete rows manually. Inspect the preview after removing title rows, then promote the actual header row and assign types.
A healthy import has every intended table present, a recorded row count, and recognizable field names. Keep a small inventory sheet listing each table, its source, and what a row represents. That last detail matters more than a tidy tab name: order headers and order lines aren't interchangeable.
Build Relationships and Measures That Keep Totals Right
Before drawing relationships, write the grain of every transaction table. An Orders table might contain an order line per row, while Refunds contains a refund event per row. Joining those tables directly on order number can create ambiguous business logic because neither side necessarily contains unique orders.
Keep transactional facts separate from descriptive dimensions, such as Customer, Product, and Date. Standardize matching key types and confirm that each dimension key is unique. Microsoft's DAX overview explains that calculations depend on relationships and matching key values, which is why an incorrect or inactive relationship can produce plausible but misleading results.
Connect dimensions before writing calculations
In Diagram View, drag the dimension's key to the matching fact-table column. Confirm the intended one-to-many relationship is active, with the unique dimension on the one side.
Connect Customer to Orders and Refunds separately when both contain a valid customer key. If refunds contain only an order reference, resolve the customer mapping during preparation or design an appropriate order dimension. Don't force a many-to-many relationship to make a diagram look connected.
Date relationships need equal care. Decide whether a report means sales by order date, refunds by refund date, or refunds attributed to the original sale. Those are different questions, not alternate formatting choices.
Define business measures explicitly
Create a Revenue measure using Revenue := SUM(Orders[SalesAmount]). This assumes SalesAmount contains the sales basis you intend to report, rather than an unexplained mixture of tax, shipping, and product charges.
For margin, use measures such as Gross Profit := [Revenue] - [Cost of Sales] and Gross Margin % := DIVIDE([Gross Profit], [Revenue]). DIVIDE handles a zero or blank denominator without forcing a worksheet error into the report.
Use the measure dialog available in your Excel build, commonly Power Pivot > Measures > New Measure in the main Excel ribbon. In the Power Pivot window, you can also enter measures in the calculation area; command placement differs between builds.
Calculated column or measure
| Criterion | Calculated column | Measure |
|---|---|---|
| Where it is calculated | Row by row, stored in the model | At query time, for each PivotTable filter selection |
| Effect on model size | Adds stored data and refresh cost on large tables | Stores a formula, not a result column or additional rows |
| Responds to slicers and filters | Remains a fixed value on each row | Recalculates for each filter context |
| Best use | Grouping keys, labels, and row-level flags | Totals, ratios, and rates such as revenue and margin |
| Cost when the formula changes | Recalculates the whole column | Evaluates when queried, including after a PivotTable refresh |
Practical rule: Calculate margin from total profit divided by total revenue. Don't average row-level margin percentages and call the result company margin.
Reconcile before adding presentation
Insert a PivotTable through Insert > PivotTable > Use this workbook's Data Model. Put Region in Rows and Revenue in Values, then complete this QA sequence:
- Check record completeness. Compare row counts and identify null or unmatched keys.
- Check cardinality. Confirm unique dimension keys and the intended relationship direction.
- Reconcile selections. Match the unfiltered grand total to an independent control, then test filtered totals.
- Test exceptions. Inspect boundary dates, currencies, duplicate transactions, and refund treatment.
For a useful control-sheet approach, CEFCore's nonprofit financial data reconciliation tips provide context for documenting differences rather than hiding them with adjustments. Apply that discipline alongside clear assumptions and checks from financial modeling best practices.
Finish with a measure whose total you can explain. A polished dashboard isn't evidence that the calculation is right.
Know the Limits, Then Speed Up Refresh Without Changing Totals
A worksheet supports 1,048,576 rows and 16,384 columns, according to Microsoft's guidance on datasets larger than the Excel grid. A hypothetical transaction export containing 1.2 million rows therefore belongs in a connection loaded to the Data Model, not in a worksheet staging tab.
Grid capacity and model capacity aren't the same thing. Loading outside the grid avoids the worksheet ceiling, but it doesn't give your computer unlimited memory.
Excel and PivotTable limits
The remaining field limits below follow the same Microsoft specifications. Treat them as ceilings, not as targets for dashboard design.
| Limit | Value | What it means for a model |
|---|---|---|
| Rows on a worksheet | 1,048,576 | Source data beyond this stays in the Data Model rather than a sheet |
| Columns on a worksheet | 16,384 | Trim wide exports before loading |
| Unique items per PivotTable field | 1,048,576 | High-cardinality IDs can make filters expensive |
| Report filters per PivotTable | 256 | Keep report-filter designs focused; slicers have separate behavior |
| Value fields per PivotTable | 256 | Split unwieldy reports rather than stacking every measure |
| PivotTables per worksheet and row or column fields | Limited by available memory | Test peak usage on the target machine |
High-cardinality columns contain many distinct values, such as invoice numbers or customer identifiers. They can make filter lists expensive to populate even when the visible report is small. A revenue summary with a handful of regions may still carry a large invoice-level model underneath it.
Open Task Manager while refreshing and record Excel's peak memory use. Repeat the test on the machine that will run the reporting cycle, with the applications its owner normally has open.
A workbook that refreshes on its builder's workstation isn't ready for handoff until it also works in the reporting owner's environment.
Optimize in a controlled order
Microsoft's Excel performance guidance recommends keeping calculation dependencies simple and avoiding formulas that use PivotTable results as intermediate totals. Apply that principle through controlled changes, not a wholesale rewrite whose effects you can't isolate.
Record a baseline. Save a working copy and note workbook size, full refresh duration, and the time required for representative filter changes. Record the source snapshot and control totals too, so a faster result isn't merely a smaller dataset.
Remove unused data before loading. Drop columns that aren't needed for relationships, measures, audit tracing, or reporting. Remove irrelevant records with documented rules, but don't delete historical transactions just because they make the file larger.
Use a star schema and sensible keys. Keep dimensions around transaction facts, and prefer numeric surrogate keys where the source architecture supports them. Don't generate unrelated index columns independently in separate queries and assume matching numbers represent matching customers.
Reuse measures. Define the approved calculation once and use it across reports. Copying worksheet formulas around a PivotTable creates additional places for someone to change a denominator or inclusion rule.
Reduce unnecessary recalculation. Review volatile worksheet formulas and calculated columns that could be removed or prepared upstream. A stored classification needed in a slicer may justify a column; a revenue total generally belongs in a measure.
Benchmark each change. Refresh, repeat the same filter interactions, and reconcile again. Keep the change only when it improves the relevant behavior without altering approved results.
Removing detail is a trade-off, not an automatic improvement. If finance needs invoice-level exception tracing, aggregating everything to monthly customer totals may make the workbook faster while making it unsuitable for review.
Keep necessary traceability, but separate detailed exception work from the management summary when practical. The best design serves the decision without making every viewer review every transaction.
Keep report dependencies explicit
If a worksheet formula must retrieve a PivotTable result, use GETPIVOTDATA rather than a positional reference such as =C12. Moving a row field can change what occupies that cell, while GETPIVOTDATA identifies the requested measure and field selections.
GETPIVOTDATA doesn't fix a bad measure. It makes the retrieval less fragile, so inspect the measure itself before troubleshooting the display formula.
Place a compact measure definition beside management reports. Include:
- Numerator and denominator: State exactly what the ratio compares.
- Time basis: Specify the relevant transaction date and reporting period.
- Currency: Identify the currency basis and conversion treatment.
- Inclusion rules: Explain cancellations, refunds, internal transactions, and other exclusions.
Before distributing a slow or suspicious workbook, check for stale caches, broken source ranges, and excluded records. Then inspect ambiguous date relationships and calculations whose meaning changes under filter context.
A grand total can match while regional allocations are wrong. Test the actual decisions users make, such as comparing regions or selecting a reporting month, instead of accepting a successful refresh as sufficient proof.
Govern the Model Before You Share It
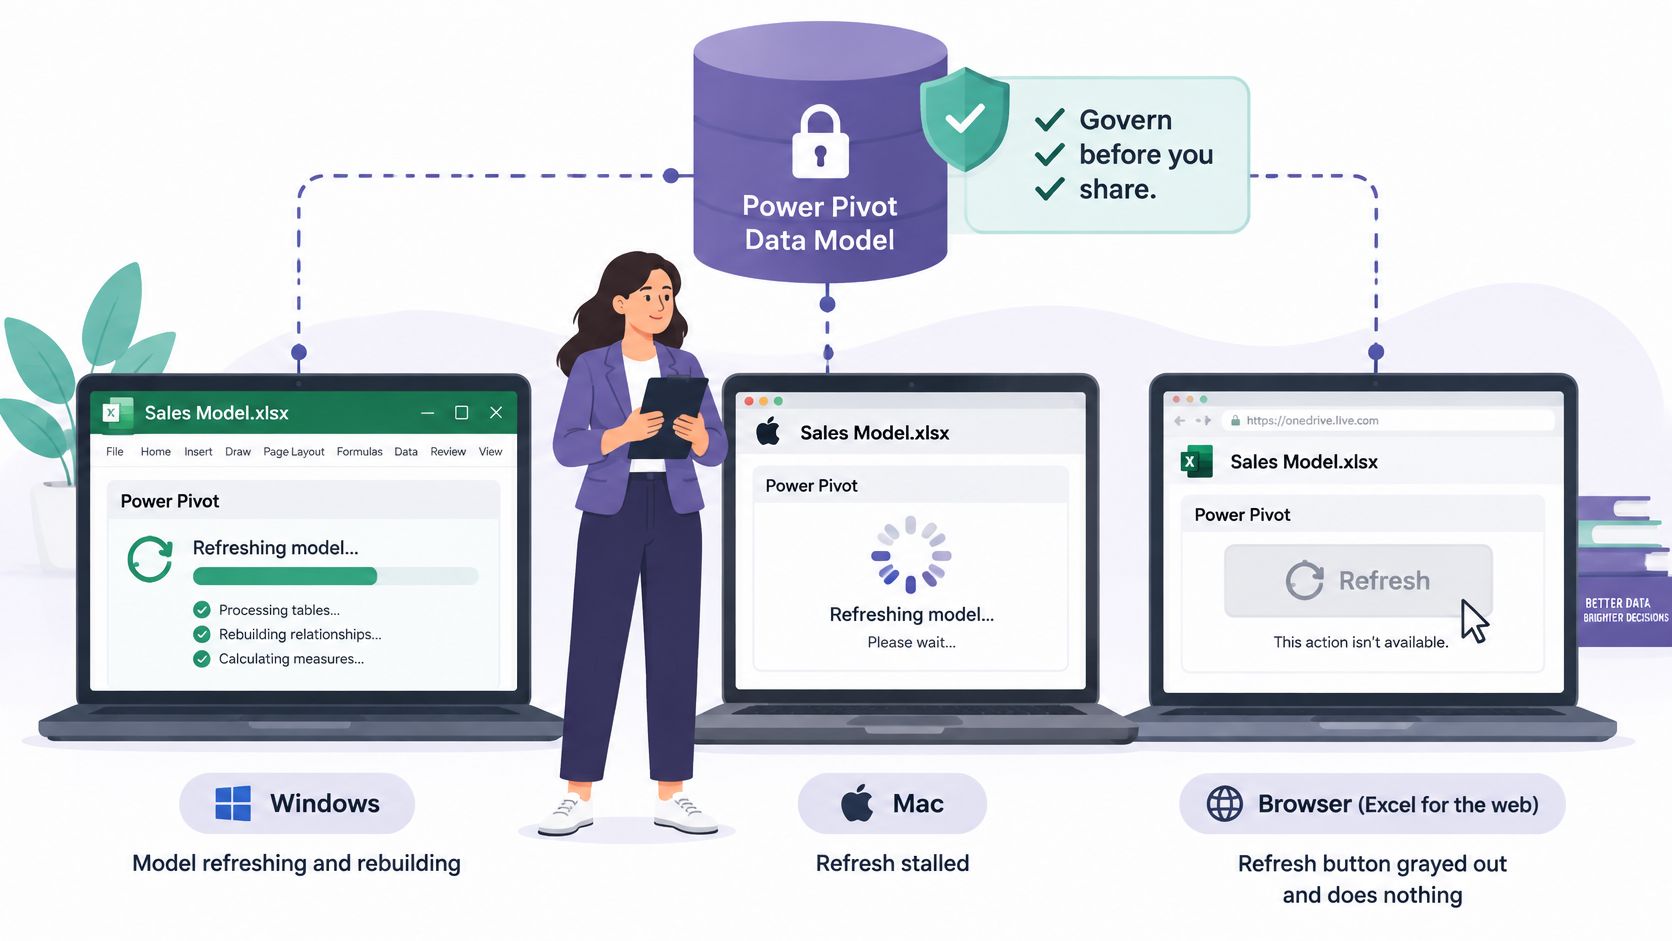
The model builds on Windows, the CFO reviews it on a Mac, and an external adviser opens it in a browser. A refresh attempt in that browser may leave the displayed figures unchanged. Unless someone checks the reporting cutoff, everyone can discuss a different version of the truth without realizing it.
Microsoft describes Power Pivot as a desktop technology, with a single Data Model in a workbook and no VBA support inside the Power Pivot window. Don't assume Windows authoring, Mac consumption, browser collaboration, and mobile viewing provide interchangeable capabilities.
Use this diagram as a prompt for environment testing, not as a substitute for testing the actual workbook.
Assign ownership before granting access
Name the people responsible for these roles before anyone else opens the reporting copy:
- Builder: Maintains queries, relationships, measures, and change documentation.
- Reviewer: Runs reconciliation checks and challenges unexplained differences.
- Refresh owner: Controls source connections, credentials, and the refresh procedure.
- Consumers: View approved output without changing model logic.
In a small team, someone may hold several roles, but the responsibilities still need names. Board and lender reporting also needs a sign-off owner and a written reconciliation sheet saved with the workbook.
Sharing access to a file doesn't transfer accountability for its figures.
Test the complete reporting journey
Use a compatibility checklist that records who builds the model, who refreshes it, and whether refresh requires manual intervention. List each consumer's actual environment, including Mac, mobile, and Excel for the web.
Record where source credentials are managed and who can renew them. Don't place passwords in worksheet notes or assume a connection using the builder's account will work for the finance team.
Then test opening, filtering, saving, and refreshing separately. Record the last successful refresh and source cutoff on the report itself, because opening a workbook successfully doesn't prove that it contains current transactions.
Consider Power BI or another governed platform when recurring refresh requires fragile manual steps, different environments must refresh the same dataset, or a challenged figure can't be traced. Migration still requires ownership, access control, and validation; buying another tool won't settle disputed definitions.
Fill the leadership gap without inventing a permanent role
A team may have someone who can write DAX but nobody who can approve revenue treatment, establish controls, or challenge a board metric. That's a finance leadership gap rather than an Excel skills gap, and it directly affects data-driven decision-making.
A fractional CFO service like Shiny can perform any of the tasks a traditional CFO might handle. We help startups hire a fractional CFO by matching them with pre-vetted CFOs from our talent pool.
Define the engagement around outcomes: approved measure definitions, a repeatable close-to-report process, and a clear handoff to employees. Fractional leadership works best when decision rights and ongoing ownership are explicit, not when the executive becomes another person who alone understands the workbook.
Name the builder, reviewer, and refresh owner, then add the reconciliation sheet. If nobody can take responsibility for financial sign-off, book a model review before the workbook becomes the basis for a funding or operating decision.
Shiny connects startups with pre-vetted fractional CFOs who can help establish financial controls, clarify reporting ownership, and turn Excel outputs into decision-ready information. Visit Shiny to explore a fractional finance engagement focused on your model's reconciliation, refresh process, and reporting handoff.