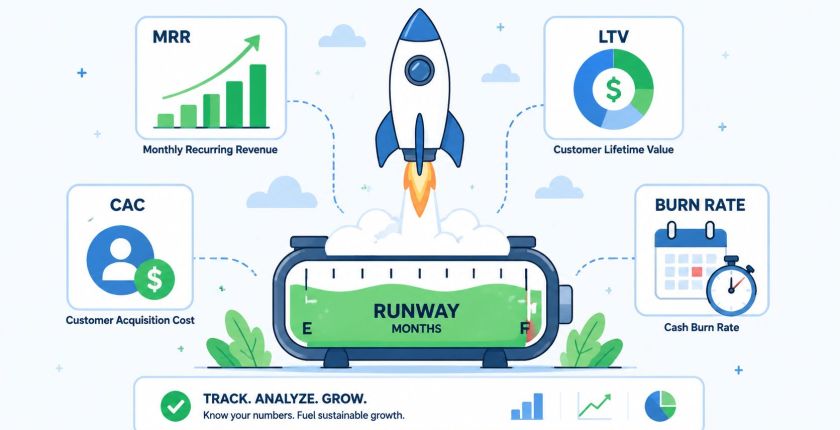
Startup Financial Metrics: Guide to Growth & Success
You can run a startup with a great product and still be one missed payroll away from panic. That's what happens when founders keep an eye on sales, but never build a clear view of startup financial metrics. The result is usually the same, a quarter ends, cash is tighter than expected, growth is slower than hoped, and the team is left asking what happened.
The fix starts with a simpler habit, measure the business the way investors and operators do. A startup that knows its burn rate, runway, CAC, LTV, and recurring revenue can see problems earlier and make better decisions faster. A startup that ignores those numbers often confuses motion with progress.
Why Metrics Matter for Startup Survival
A founder I spoke with once described a painful mid-quarter surprise. Revenue was coming in, the team was busy, and the board update looked fine on the surface, until the cash balance made the true situation clear. The company had been spending faster than it understood, and because no one had been tracking the right numbers in a consistent way, the warning signs arrived late.
That is what flying blind looks like. Burn rate and runway are survival numbers. Runway works like a timer on your cash, it is the money you have available divided by monthly burn, and burn should be treated as a cash-survival metric rather than a generic expense line. Lazo and Andreessen Horowitz both treat these measures as the first layer of startup decision-making. If you do not know how quickly cash is leaving and how long it lasts, you do not really know what options you have.
A startup can be growing and still be in trouble. Revenue can look encouraging while the bank balance tells a different story, especially when acquisition costs are high or collections lag. In startup finance, investors often look for LTV:CAC of 3:1 or higher and CAC payback under 12 months because those ratios point to growth that can support itself, a standard also reflected in Silicon Valley Bank's guidance on startup KPIs.
Practical rule: if you cannot explain your cash position in one minute, your metric system is too weak for the stage you are in.
The point is not to build a giant dashboard on day one. It is to build a disciplined view of what creates value, what drains cash, and what buys you time. That view should change as the company changes. A pre-revenue startup needs different signals from a subscription business, and a later-stage team needs different controls from one still searching for product-market fit. That is also where fractional finance leadership can help, since an experienced operator can sort the noise from the signals and set the right metric priorities for the current stage.
For founders who want a broader KPI framework, this startup metrics guide is a useful next reference. Once the lens is in place, the rest of the numbers become easier to read.
Understanding the Key Startup Financial Metrics
A founder can stare at a dashboard full of numbers and still miss the full story. The first step is to sort startup financial metrics by the question they answer, growth, efficiency, or survival. Once you do that, the numbers stop competing with one another and start working like instruments in the same control room.
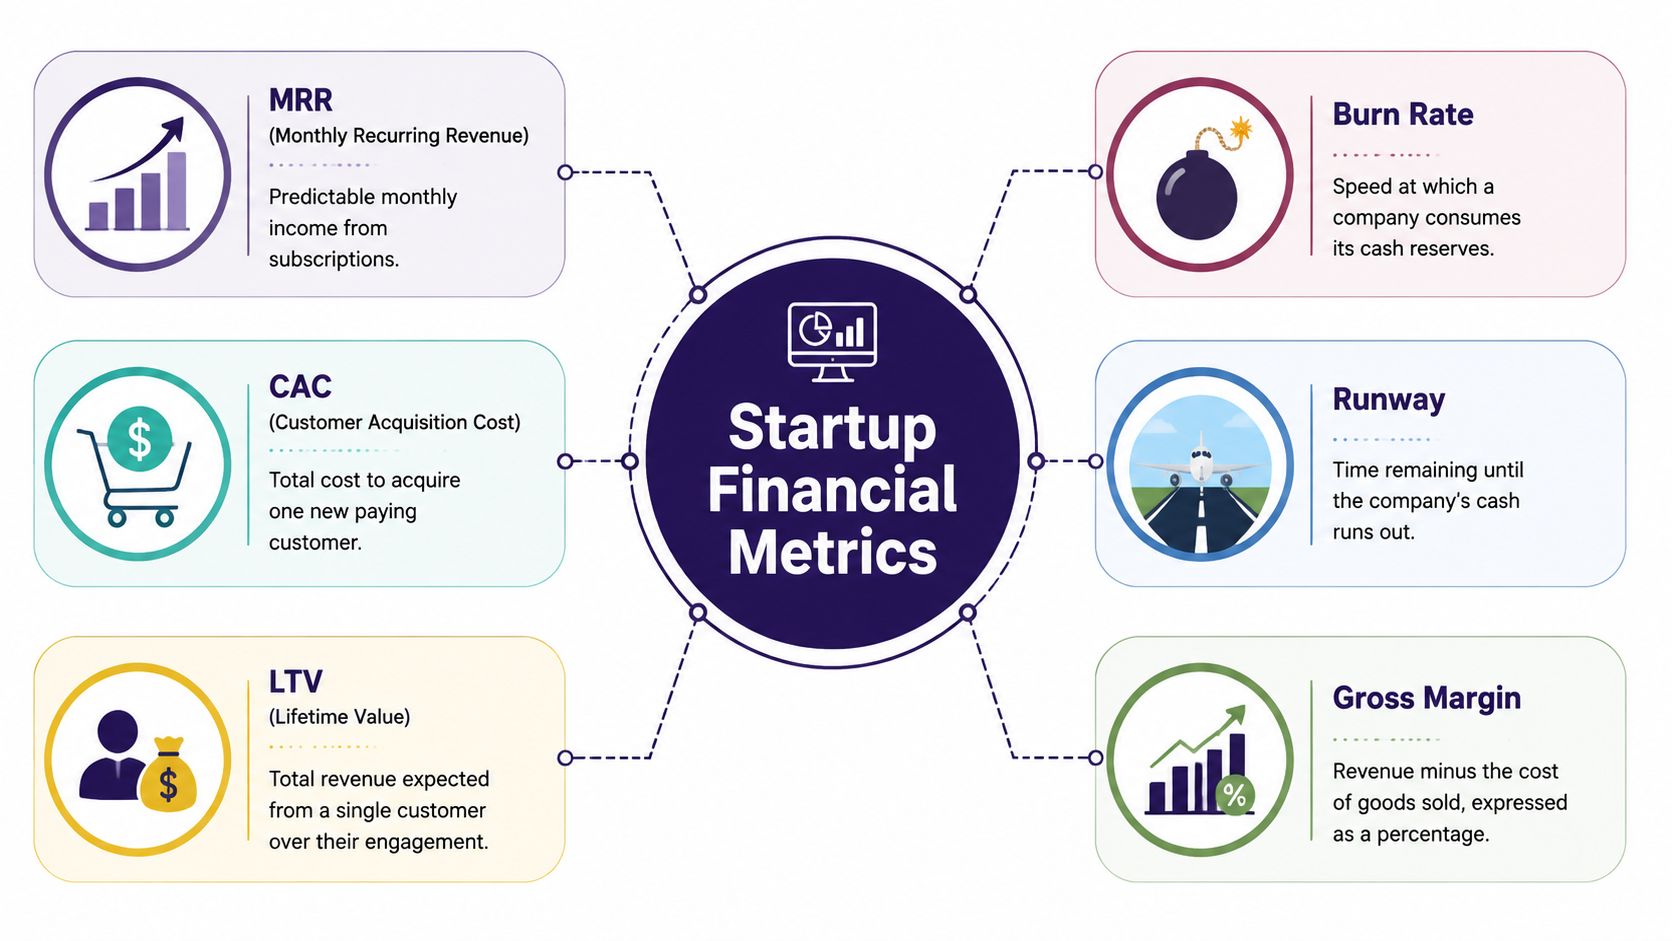
The core metrics and what they really mean
MRR, or Monthly Recurring Revenue, is the predictable monthly income from subscriptions. It shows the size of the recurring base you have built, which matters most in software and subscription businesses because it reveals whether revenue is becoming steadier over time.
CAC, or Customer Acquisition Cost, is the total cost to win one new paying customer. Marketing spend, sales effort, and the tools behind the acquisition motion all belong in the calculation. On its own, CAC is only part of the picture. It becomes useful when you compare it to the revenue that customer can produce.
LTV, or Lifetime Value, is the total revenue expected from a customer over the full relationship. It answers a simple question, is the customer worth what it costs to acquire them and keep them? In practice, many investors still use LTV:CAC of 3:1 or higher as a sign that the economics have room to support growth.
Burn rate shows how quickly cash leaves the business each month. Runway tells you how long the company can keep operating before the cash runs out, using cash on hand divided by monthly burn. These two metrics work together like a fuel gauge and a distance-to-empty readout, so founders can see both pace and remaining time.
Gross margin shows how much revenue remains after the direct cost of delivering the product. In SaaS, higher gross margin gives the business more room to absorb acquisition, support, and overhead costs. UK SaaS guidance places 75%+ gross margin among the common benchmarks for that model.
Cohort metrics group customers by the time they joined and track how their behavior changes over time. That makes it easier to see whether newer customers are churning faster, expanding more slowly, or responding differently from older groups.
A simple way to calculate them
Start with the question you need answered. If cash is the concern, calculate burn rate and runway first. If growth efficiency is the issue, calculate CAC, LTV, and LTV:CAC next. If the business depends on subscriptions, MRR should sit near the top of the list because it shows the recurring base you can plan around.
A small example helps. If a startup spends heavily to win one customer, that customer has to repay the acquisition cost through future revenue. If the value of that customer is roughly three times the acquisition cost, the business is closer to the commonly used viability benchmark.
Keep the first version of your dashboard small. A few reliable metrics beat a long list of numbers nobody trusts.
For founders building their first reporting pack, the key performance indicators for startups guide is a useful reference because it organizes metrics by growth, efficiency, and return on effort. That kind of structure makes it easier to decide which numbers deserve attention now, and which ones can wait until the company is further along.
Benchmarking Metrics by Stage and Model
A founder reviewing a dashboard for the first time can easily read the wrong signal. A pre-product team needs to learn quickly, while a scaling SaaS company needs to prove that growth is not buying itself with weak unit economics. Benchmarks only help when they match the business model and the growth phase.
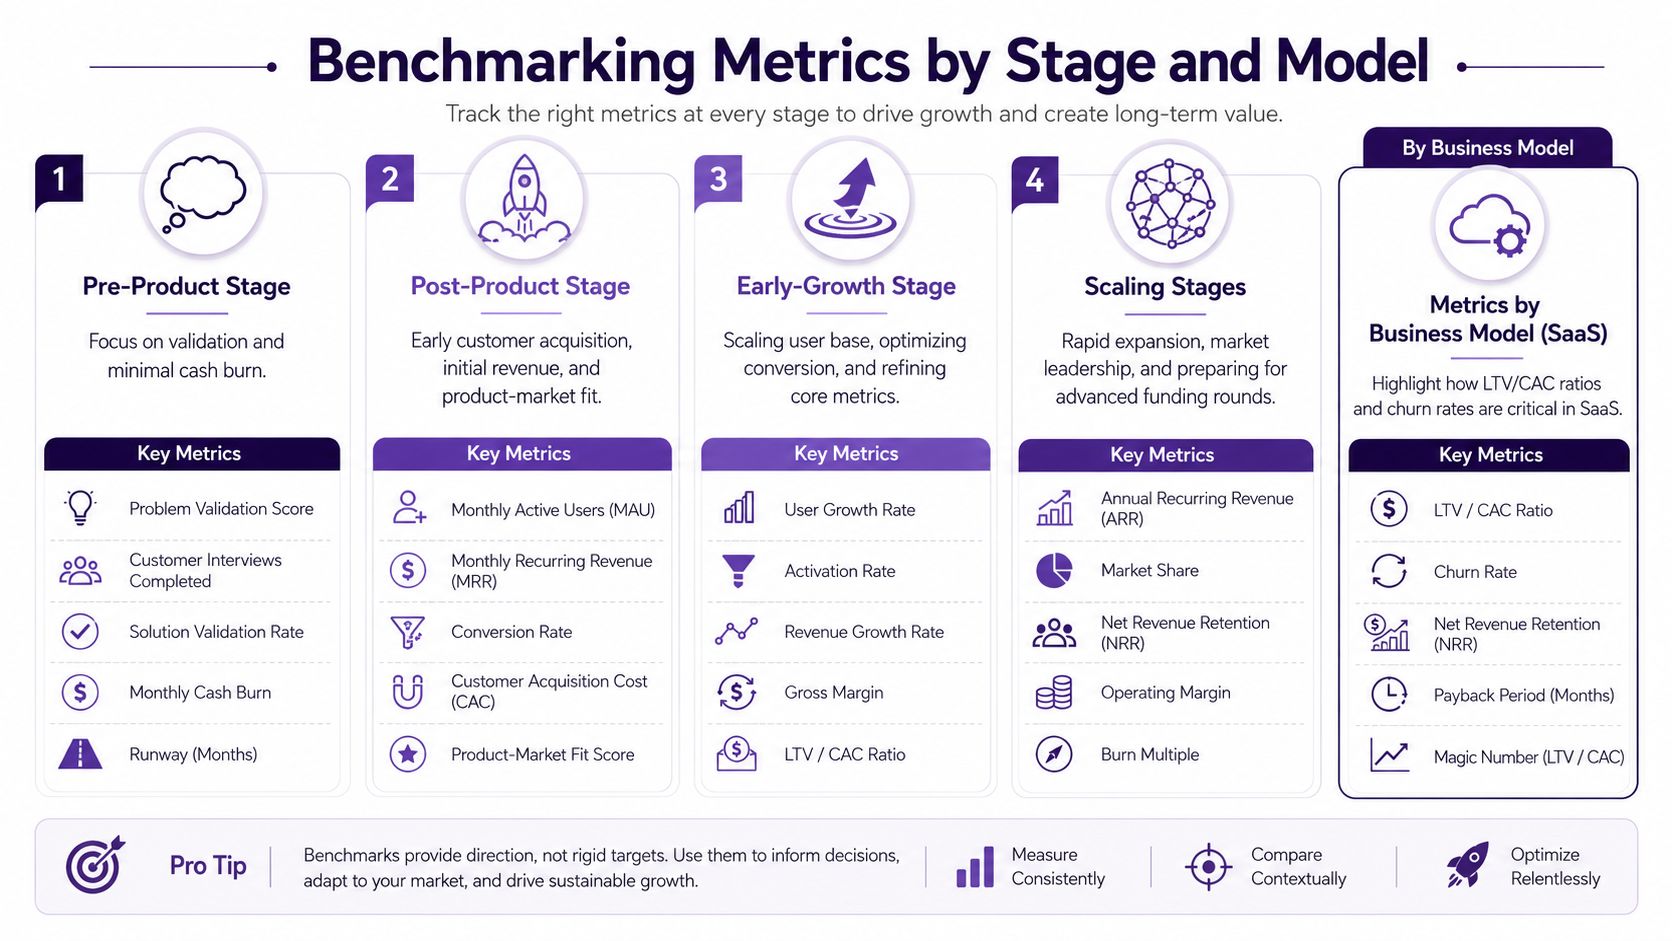
Stage changes what you should care about
Early on, cash visibility and runway usually matter more than polished efficiency ratios. The company is still testing what customers want and what it costs to deliver the product or service. As the business matures, the focus moves toward NRR, GRR, CAC payback, and the Rule of 40 for scaling SaaS, because retention and expansion begin to matter more than pure discovery. Trust Nimbl frames that shift clearly, and the same source also reminds founders that a single universal checklist does not fit every startup.
That point is easy to miss when a team copies a dashboard from a very different company. A better benchmark asks which metrics belong to this stage, this model, and this operating problem. A growth stage company guide can help founders place their business in the right phase before they start comparing numbers.
For SaaS businesses, benchmark ranges often center on gross margin, LTV:CAC, CAC recovery, and runway. These metrics suit subscription economics because recurring revenue, acquisition cost, and retention all shape the same engine. As noted earlier, the right target set changes once the business moves from learning to scaling.
How business model changes the scoreboard
A subscription company should pay close attention to retention and expansion because recurring revenue compounds over time. A hardware or inventory-heavy startup needs to watch working capital more closely because cash can get stuck in stock or delayed invoices. In those businesses, the question is not only how much revenue was booked, it is how quickly that revenue turns into usable cash.
Decision rule: if cash timing is uncertain, treat working capital metrics as part of the main dashboard, not an appendix.
Pre-product teams usually care about survival and learning. Post-product teams start testing acquisition. Early-growth companies sharpen unit economics. Scaling companies need to show that new growth does not damage efficiency. The framework changes with the company, the way a coach changes the scoreboard depending on whether the team is practicing, competing, or trying to close out a game.
For founders, the practical test is simple. If a metric does not help answer the next operating question, it can wait. If it helps determine whether the company can keep learning, selling, or scaling without running out of room, it belongs near the top of the dashboard.
Implementing Tracking and Reporting Best Practices
A startup's metrics only help if the numbers mean the same thing every time they are reviewed. When one person pulls revenue from the accounting system, another uses a sales spreadsheet, and a third checks a product dashboard, the result is confusion, not clarity. The first job is to build a reporting routine that keeps the source data clean and the review process steady.
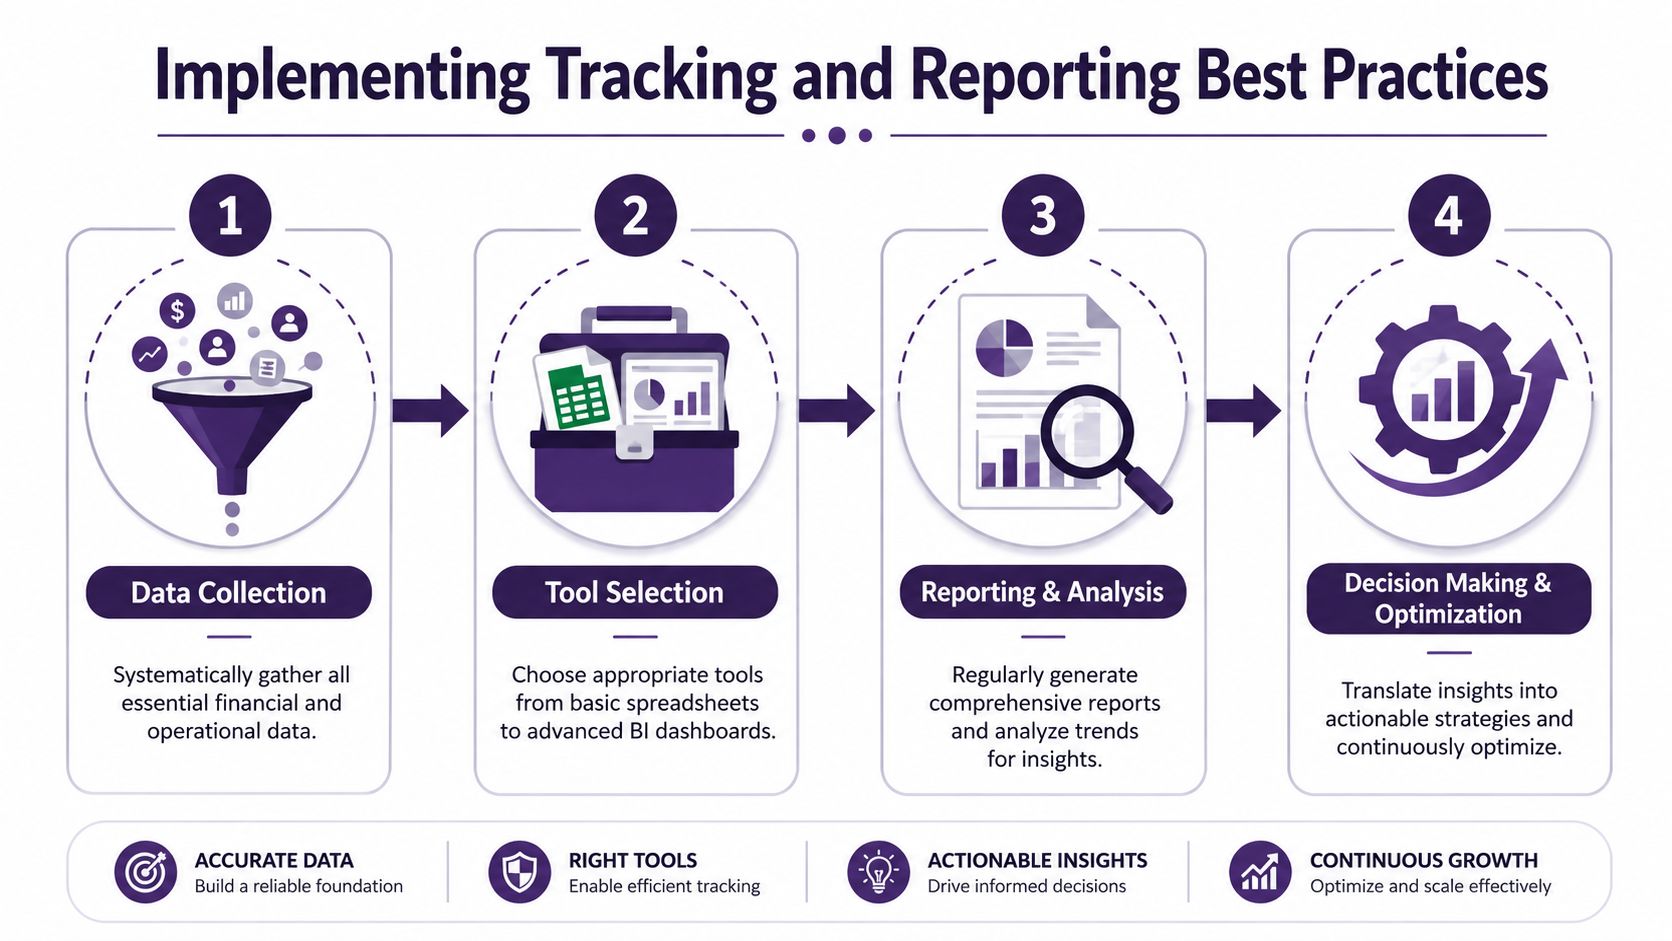
Build a system founders can actually maintain
Start with data collection. Pull revenue, cash, customer counts, invoices, and acquisition spend from the systems you already use. In the earliest stage, a spreadsheet can be enough if one person owns the source of truth and updates it consistently.
Then choose the reporting tool based on complexity. A small startup may only need Google Sheets, a simple charting layer, and a shared monthly report. A more mature company may move into a BI dashboard, but the purpose stays the same, one version of the truth that the team can trust.
The right cadence matters just as much as the tool. Weekly reviews should surface surprises, while monthly reviews should focus on trends, variances, and decisions. That rhythm helps the team separate short-term noise from a real shift in the business.
Turn the report into action. If burn is rising faster than expected, or revenue collection is slowing, assign an owner and a deadline. A metric that never changes a decision is only a number on a page.
A monthly report structure that works
- Top-line summary: what changed since last month, and why it changed.
- Cash position: current cash, burn rate, and runway.
- Revenue quality: MRR or other recurring revenue, plus retention signals where relevant.
- Unit economics: CAC, LTV, and payback period when the model supports it.
- Working capital: DSO, DPO, and inventory turns if the business bills later or holds inventory.
- Action items: what needs to be fixed before the next review.
For startups, burn rate works best as a cash-survival metric. Gross burn is total monthly outflow, net burn subtracts revenue, and runway equals cash on hand divided by monthly burn. That framing keeps the report easy to read for founders and investors, especially when the business is moving through different stages and needs different metrics to stay in view.
Shiny is one option for founders who want part-time finance leadership to set up the reporting system, review KPIs, and support cash flow planning without hiring full time.
Common Mistakes and How to Avoid Them
The most common mistake is treating one metric as if it tells the whole story. A founder may celebrate revenue growth while ignoring whether the company is paying too much to acquire each customer. Another founder may panic about burn without asking whether the team is converting that spend into a better future base.
Three errors that distort judgment
Using gross burn alone. Gross burn shows spending, but it hides offsetting revenue. A company with heavy gross burn and meaningful recurring income may have a very different cash position from a company with the same expense line and no revenue at all. That's why net burn and runway belong in the same conversation.
Ignoring working capital. Startups that invoice customers, hold inventory, or pay vendors on different schedules can look healthier than they are if they only track revenue and burn. Independent startup-finance guidance specifically calls out DSO, DPO, and inventory turns because these affect how long cash lasts (LTSE).
Comparing across the wrong model. A SaaS company and a hardware company may both be “growing,” but their cash cycles are not the same. The first may prioritize recurring revenue and retention. The second may care more about collecting cash quickly and keeping inventory from tying up the balance sheet.
If a metric never changes the next decision, it probably doesn't belong on the main dashboard.
Guardrails that keep teams honest
Build a short review checklist and use it every month. Ask whether the business is measuring the right stage-specific metrics, whether the cash picture is current, and whether any customer or supplier timing issue could distort the numbers. That kind of discipline prevents false confidence.
A second guardrail is to separate signal from noise. One bad week doesn't change a strategy, but repeated patterns do. The goal is to notice those patterns early enough to act before they become emergencies.
When to Engage Fractional Finance Leadership
Founders usually wait too long to bring in finance help. They try to handle forecasting, board reporting, and cash planning between product, hiring, and sales, then wonder why the numbers keep slipping. Fractional finance leadership solves that gap by bringing senior expertise into the business without forcing a full-time hire too early.

Signals that it's time
If the company is preparing for a raise, rebuilding its budget, or struggling to explain its numbers cleanly, part-time finance support can close the gap fast. The same is true when a founder needs a better model for burn, runway, or investor reporting, but doesn't yet need a full in-house finance team.
Fractional executives typically work a limited number of hours per week, which makes them easier to match to the stage where the company is still balancing cash preservation with growth. A skilled part-time finance lead can also help standardize KPI definitions so the team stops arguing about whose spreadsheet is right.
That's where a marketplace like what a fractional CFO does becomes relevant. The value isn't just seniority, it's having someone who can build the financial rhythm, clean up reporting, and prepare the company for the next round of decisions.
Why the timing matters
A founder who waits until the business is under pressure usually pays more in confusion than a founder who brings in help earlier. The first founder spends time stitching together reports. The second gets a clearer view of cash, metrics, and priorities before the next major decision.
That distinction matters most when the company is changing stage. A pre-product team needs survival metrics. A post-product team needs proof of demand. A scaling company needs finance leadership that can translate numbers into action.
Sample KPI Templates and Dashboard Examples
A useful dashboard should read like a story. The top line shows whether the company is healthy, the middle explains why, and the lower section points to what needs attention next. If the layout does not support that flow, founders end up staring at a wall of numbers without a clear decision path.
A simple way to build that story is to group metrics by what they answer. Some numbers show demand. Others show how efficiently the business turns cash into growth. A third group shows how long the company can keep operating if revenue slows.
Sample KPI Dashboard
| Metric | Formula | Benchmark |
|---|---|---|
| MRR | Monthly recurring revenue from active subscriptions | Trend should be clear and consistent |
| CAC | Total acquisition spend divided by new paying customers | Should be measured against LTV |
| LTV | Expected revenue from one customer over the relationship | Should support efficient acquisition |
| LTV:CAC | LTV divided by CAC | 3:1 or higher |
| CAC Payback | Time needed to recover CAC from gross profit | Under 12 months |
| Gross Margin | Revenue minus direct delivery costs, divided by revenue | 75%+ is a common SaaS benchmark |
| Burn Rate | Monthly cash outflow, net of revenue when relevant | Track against runway |
| Runway | Cash on hand divided by monthly burn | Should support the next operating cycle |
How founders can use it
A dashboard like this works best on a fixed schedule. Review it with the leadership team each month, and keep the definitions stable so the trend lines mean the same thing every time. If one person updates CAC one way and another person updates it differently, the dashboard stops being useful.
Subscription businesses usually get the clearest picture by looking at LTV:CAC and CAC payback together. If the company spends more to acquire customers but takes too long to recover that spend, the model gets harder even when revenue keeps rising. These metrics belong on the same page because one shows value created and the other shows how long cash stays tied up.
A stage-by-stage view makes the dashboard sharper. Early-stage teams should care most about whether the company is learning quickly and preserving cash. Growing teams should put more weight on efficiency and repeatable demand. Later-stage teams need a dashboard that connects growth to control, especially when hiring, pricing, and cash planning start moving at the same time.
That is also the point where fractional finance leadership can help. A part-time finance lead can clean up definitions, set the reporting rhythm, and make sure the dashboard reflects the company's model instead of a generic template.
For more complex teams, a simple cohort view can sit under the main dashboard and show how different customer groups behave over time. That helps founders see whether retention, expansion, or payment timing is changing the quality of growth. It also gives the finance lead a better base for explaining why one month looks strong on revenue but weak on cash.
If you want a cleaner financial system without hiring a full-time executive, Shiny can connect you with part-time finance leadership that helps set up dashboards, reporting, and cash flow planning around the metrics that matter most.